Our system will evaluate the answer based on this AI-generated description.
The image presents a line graph detailing monthly average rainfall (mm) for Marrakesh, Dublin, Nur-Sultan, Sydney, and Tokyo in 2020; in January, Marrakesh records ~145mm, Dublin ~80mm, Nur-Sultan ~25mm, Sydney ~120mm, Tokyo ~50mm; in February, Marrakesh ~130mm, Dublin ~80mm, Nur-Sultan ~20mm, Sydney ~110mm, Tokyo ~55mm; in March, Marrakesh ~127mm, Dublin ~75mm, Nur-Sultan ~30mm, Sydney ~125mm, Tokyo ~70mm; in April, Marrakesh ~120mm, Dublin ~65mm, Nur-Sultan ~40mm, Sydney ~120mm, Tokyo ~85mm; in May, Marrakesh ~120mm, Dublin ~60mm, Nur-Sultan ~50mm, Sydney ~105mm, Tokyo ~100mm; in June, Marrakesh ~110mm, Dublin ~55mm, Nur-Sultan ~60mm, Sydney ~95mm, Tokyo ~120mm; in July, Marrakesh ~130mm, Dublin ~50mm, Nur-Sultan ~65mm, Sydney ~75mm, Tokyo ~130mm; in August, Marrakesh ~165mm, Dublin ~60mm, Nur-Sultan ~70mm, Sydney ~85mm, Tokyo ~145mm; in September, Marrakesh ~170mm, Dublin ~60mm, Nur-Sultan ~55mm, Sydney ~90mm, Tokyo ~140mm; in October, Marrakesh ~178mm, Dublin ~80mm, Nur-Sultan ~45mm, Sydney ~110mm, Tokyo ~130mm; in November, Marrakesh ~185mm, Dublin ~90mm, Nur-Sultan ~40mm, Sydney ~120mm, Tokyo ~115mm; in December, Marrakesh ~180mm, Dublin ~90mm, Nur-Sultan ~30mm, Sydney ~125mm, Tokyo ~80mm.
Given the complexity of the image, the above description may not be entirely accurate.
Skyrocket your IELTS band score by 1-2 points in under a month with our premium plan!
Note: Both the topic and the answer were created by one of our users.
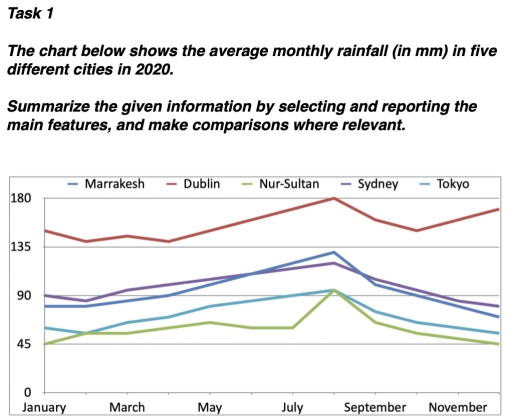
The chart shows the average monthly rainfall (in mm) in five different cities in the year two thousand and twenty. It can be seen that the most rainy city was Dublin. On the other hand, Marrakesh and Sydney had the most similar indicator to each other. However, the lowest was in Nur-Sultan in all time comparet to another country.
All diagram increased significantly from March to August. Tokyo and Sydney reach a peak in last month of summer. Moreover, in the same time Dublin reach a its low, and Nur-Sultan sharply increased, but then fluctuated between 47-50mm. The most significant fall was in Sydney. Roughly from 130 to 80mm.
In general, the most growth can be seen from April to August, but not including Nur-Sultan. By contrast, not all but some graphs reach a low in Autumn. The overall trend shows changes in average monthly rainfall, what were in different parts of the world.
Word Count: 154