Our system will evaluate the answer based on this AI-generated description.
The image presents a line graph detailing monthly average rainfall (mm) for Marrakesh, Dublin, Nur-Sultan, Sydney, and Tokyo in 2020; in January, Marrakesh records ~145mm, Dublin ~80mm, Nur-Sultan ~25mm, Sydney ~120mm, Tokyo ~50mm; in February, Marrakesh ~130mm, Dublin ~80mm, Nur-Sultan ~20mm, Sydney ~110mm, Tokyo ~55mm; in March, Marrakesh ~127mm, Dublin ~75mm, Nur-Sultan ~30mm, Sydney ~125mm, Tokyo ~70mm; in April, Marrakesh ~120mm, Dublin ~65mm, Nur-Sultan ~40mm, Sydney ~120mm, Tokyo ~85mm; in May, Marrakesh ~120mm, Dublin ~60mm, Nur-Sultan ~50mm, Sydney ~105mm, Tokyo ~100mm; in June, Marrakesh ~110mm, Dublin ~55mm, Nur-Sultan ~60mm, Sydney ~95mm, Tokyo ~120mm; in July, Marrakesh ~130mm, Dublin ~50mm, Nur-Sultan ~65mm, Sydney ~75mm, Tokyo ~130mm; in August, Marrakesh ~165mm, Dublin ~60mm, Nur-Sultan ~70mm, Sydney ~85mm, Tokyo ~145mm; in September, Marrakesh ~170mm, Dublin ~60mm, Nur-Sultan ~55mm, Sydney ~90mm, Tokyo ~140mm; in October, Marrakesh ~178mm, Dublin ~80mm, Nur-Sultan ~45mm, Sydney ~110mm, Tokyo ~130mm; in November, Marrakesh ~185mm, Dublin ~90mm, Nur-Sultan ~40mm, Sydney ~120mm, Tokyo ~115mm; in December, Marrakesh ~180mm, Dublin ~90mm, Nur-Sultan ~30mm, Sydney ~125mm, Tokyo ~80mm.
Given the complexity of the image, the above description may not be entirely accurate.
Skyrocket your IELTS band score by 1-2 points in under a month with our premium plan!
Note: Both the topic and the answer were created by one of our users.
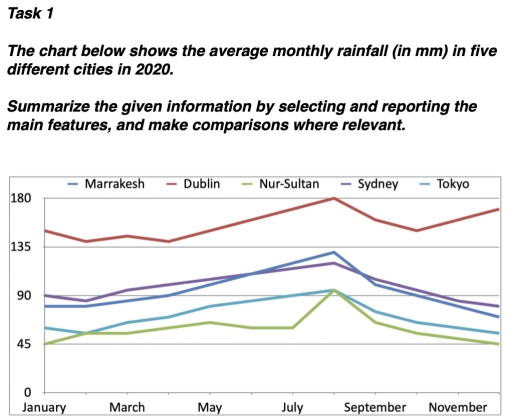
The chart illustrates changes in rainfall per month in the five capitals of various countries in 2020.
One of the main features is thehigh rainfall in Dublin compared to other cities, which figures remained below 135 mm throughout the year. At the same time, the lines for Marrakesh and Sydney have contrast similiarity in tendencies and ranges of numbers. However, all of the graphics’ peaks fall on August, although only Dublin experiences one more increase since October.
According to the chart, Dublin has significantly larger amounts of rain than other places, its line reaches the highest point of 180 mm and decreases until the middle of autumn, after which, starts to climb up again.
Most of the graph lines show similar behaviour of changes and have their biggest numbers in the same month. Most of all correlate statistics of Marrakesh and Sydney, although the last one has a marginally wider range of figures and does not go down in winter.
Word Count: 160