Our system will evaluate the answer based on this AI-generated description.
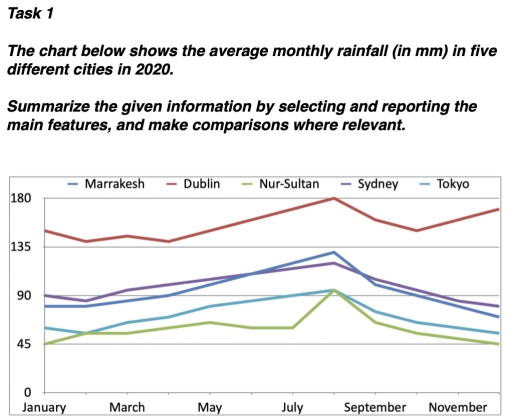
The image presents a line graph detailing monthly average rainfall (mm) for Marrakesh, Dublin, Nur-Sultan, Sydney, and Tokyo in 2020; in January, Marrakesh records ~145mm, Dublin ~80mm, Nur-Sultan ~25mm, Sydney ~120mm, Tokyo ~50mm; in February, Marrakesh ~130mm, Dublin ~80mm, Nur-Sultan ~20mm, Sydney ~110mm, Tokyo ~55mm; in March, Marrakesh ~127mm, Dublin ~75mm, Nur-Sultan ~30mm, Sydney ~125mm, Tokyo ~70mm; in April, Marrakesh ~120mm, Dublin ~65mm, Nur-Sultan ~40mm, Sydney ~120mm, Tokyo ~85mm; in May, Marrakesh ~120mm, Dublin ~60mm, Nur-Sultan ~50mm, Sydney ~105mm, Tokyo ~100mm; in June, Marrakesh ~110mm, Dublin ~55mm, Nur-Sultan ~60mm, Sydney ~95mm, Tokyo ~120mm; in July, Marrakesh ~130mm, Dublin ~50mm, Nur-Sultan ~65mm, Sydney ~75mm, Tokyo ~130mm; in August, Marrakesh ~165mm, Dublin ~60mm, Nur-Sultan ~70mm, Sydney ~85mm, Tokyo ~145mm; in September, Marrakesh ~170mm, Dublin ~60mm, Nur-Sultan ~55mm, Sydney ~90mm, Tokyo ~140mm; in October, Marrakesh ~178mm, Dublin ~80mm, Nur-Sultan ~45mm, Sydney ~110mm, Tokyo ~130mm; in November, Marrakesh ~185mm, Dublin ~90mm, Nur-Sultan ~40mm, Sydney ~120mm, Tokyo ~115mm; in December, Marrakesh ~180mm, Dublin ~90mm, Nur-Sultan ~30mm, Sydney ~125mm, Tokyo ~80mm.
Given the complexity of the image, the above description may not be entirely accurate.
Skyrocket your IELTS band score by 1-2 points in under a month with our premium plan!
Note: Both the topic and the answer were created by one of our users.
The line graph provides information about the monthly amount of rain in five cities in 2020, using the unit of measure (mm).
It can be clearly seen that Dublin was the most rainy city with the highest average of rain throughout the period. However, the remaining four cities showed almost similar trend of monthly rainfall despite a small drop in the middle of the year in Nur-Sultan.
Dublin saw an upward trend of rainfall, it starts with approximately 150 mm in the begining of the year and it kept going up until it peaked at 180 mm in August, then it had a little dip before it finally reached almost 170 mm in December. Nur-Sultan on the other hand, it started with just 45 mm in January then it fluctuated before it settled at the same point it started with in the first month of the year.
Marrakish, Sydney and Tokyo had a steady downfall reain in the end of the year. In general, the five cities had a sharp rise in August.
Word Count: 173
