Our system will evaluate the answer based on this AI-generated description.
The image shows a bar graph with sales revenue for four types of games, in billions, ranging from 0-18, between the years 2000-2006. In 2000, mobile phone games earned $2bn, online games $4bn, console games $6bn, and handheld games $3bn. In 2001, mobile games earned $3bn, online games $5bn, console games $10bn, and handheld games $4bn. In 2002, mobile games earned $5bn, online games $6bn, console games $12bn, and handheld games $5bn. In 2003, mobile games earned $6bn, online games $8bn, console games $14bn, and handheld games $8bn. In 2004, mobile games earned $8bn, online games $10bn, console games $16bn, and handheld games $10bn. In 2005, mobile games earned and console games earned $17bn each, online games earned $12bn, and handheld games $10bn. In 2006, mobile games earned $10bn, online games $11bn, console games $16bn, and handheld games $10bn.
Given the complexity of the image, the above description may not be entirely accurate.
Skyrocket your IELTS band score by 1-2 points in under a month with our premium plan!
Note: Both the topic and the answer were created by one of our users.
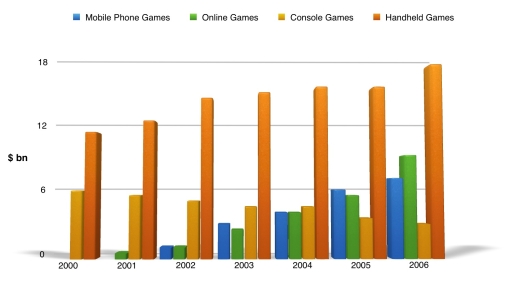
The bar chart illustrates the universal purchases of digital games between 2000 and 2006.
Overall, handheld games were the most favored sale. Whereas, console games became the least favorite type by the end of the period. Both, online and mobile phone games witnessed an upward trend.
Throughout the years, handheld games consistently dominated the global market, starting with almost 11 billion dollars in the year 2000, gradually increasing and until nearly 18 billion dollars 2006. Conversely, console games were the second highest in the year 2000 with almost 6 billion in its’ favor. Interestingly, it declined during the years to reach a rock bottom of approximately 3 billion dollars in 2006.
Online and mobile phone games started later than the others, with online games gaining popularity in the year 2000, followed by mobile games in 2002, both of them starting with less than 3 billion dollars. Moreover, they exhibited a modest growth with mobile games generally being higher than online games by a mere 1 billion. Eventually, online games outraced the mobile games in 2006, by 9 and 7 billion dollars, respectively.
Word Count: 182
