🔥 Today Only: Save 30% on Premium — Offer Ends Soon! - Upgrade Now!
Bar Chart

Band 8+: The chart below shows the number of jobs in the tourism-related industry in one UK city between 1989 and 2009. Summarise the information by selecting and reporting the main features, and make comparisons where relevant.

Image for topic: The chart below shows the number of jobs in the tourism-related industry in one UK city between 1989 and 2009. Summarise the information by selecting and reporting the main features, and make comparisons where relevant.
Our system will evaluate the answer based on this AI-generated description.
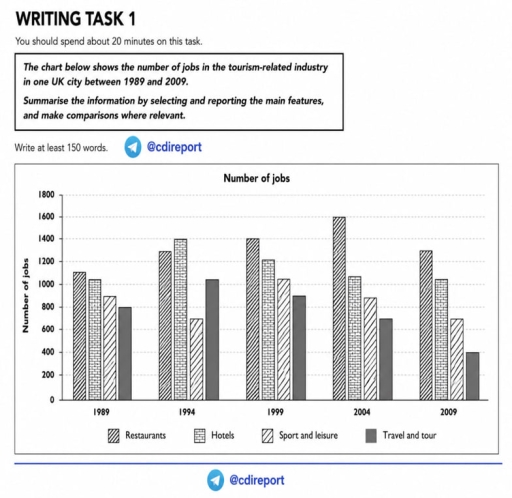
The image presents a bar chart titled "Number of jobs" with a vertical y-axis labeled "Number of jobs" ranging from 0 to 1800 in increments of 200, and a horizontal x-axis showing years: 1989, 1994, 1999, 2004, and 2009 across four categories: Restaurants, Hotels, Sport and leisure, and Travel and tour. In 1989, job figures are approximately 1,100 for Restaurants, 1,040 for Hotels, 900 for Sport and leisure, and 800 for Travel and tour. In 1994, the figures are approximately 1,300 for Restaurants, 1,400 for Hotels, 700 for Sport and leisure, and 1,040 for Travel and tour. In 1999, values stand at approximately 1,400 for Restaurants, 1,220 for Hotels, 1,040 for Sport and leisure, and 900 for Travel and tour. In 2004, the chart records approximately 1,600 for Restaurants, 1,070 for Hotels, 880 for Sport and leisure, and 700 for Travel and tour. In 2009, numbers are approximately 1,300 for Restaurants, 1,040 for Hotels, 700 for Sport and leisure, and 400 for Travel and tour.
Given the complexity of the image, the above description may not be entirely accurate.
Note: Both the topic and the answer were created by one of our users.

The bar graph gives information about how many jobs related to the tourism industry in a certain UK city between 1989 and 2009.

Overall, although sports and leisure and travel tour experienced a decline of varying degrees in their number of jobs, it was restaurants that saw an opposite trend. While jobs in restaurants demonstrated the highest point in 2004, the reverse was true in the case of those in travel and tour in 2009. Notably, jobs in hotels remained stable, showing a second highest degree in the majority of years.

The number of jobs in restaurants witnessed a moderate increase, starting at around 1100, the figure rose to about 1300, with reaching its peak at 1600 in 2004. Conversely, the figure for hotels standing at just above 1000 in second place grew to 1400 – the highest point in 1994, after which it returned to its initial position with almost 1100 in 2004, and it had been levelled off by 2009.

The remaining tourism-related industries, on the other hand, showed downturn trends. The number of jobs in sport and leisure saw a modest decline, dropping from approximately 900 to about 700 in the time frame, before rising to 1200 in 1999. As for travel and tour, having risen from 800 to 1000 between 1989 and 1994, the figure witnessed a gradual fall to 400 in 2009.

Word Count: 227

Answers On The Same Topic:

The chart below shows the number of jobs in the tourism-related industry in one UK city between 1989 and 2009. Summarise the information by selecting and reporting the main features, and make comparisons where relevant.

The bar chart illustrates changes in the number of occupations in four different tourism industries in a particular UK urban area over a 20-year period starting in 1989. In general, it is noticeable that different trends were observed in all the given categories throughout the period. Restaurants recorded the highest number of jobs almost for […]

The chart below shows the number of jobs in the tourism-related industry in one UK city between 1989 and 2009. Summarise the information by selecting and reporting the main features, and make comparisons where relevant.

The bar chart here illustrates amount of tourism-related jobs in certain UK city from year 1989 to 2009. Overall, before the 2009 Restaurants connected jobs’ value steadily increased, while since 1994 Hotels, Travel and tour is decreased. However, interest in Sport and leisure related works fluctuated wildly throughout the period. Restaurants started the period with […]

The chart below shows the number of jobs in the tourism-related industry in one UK city between 1989 and 2009. Summarise the information by selecting and reporting the main features, and make comparisons where relevant.

The diagram illustrates the number of tourism-related jobs(Restaurants, Hotels, Sport and leisure, and Travel and tour) in a UK city from 1989 to 2009. Overall, jobs in Restaurants and Hotels increased at the end of the period, while other sectors showed the reverse. It is also worth mentioning that the availability of jobs in the […]

The chart below shows the number of jobs in the tourism-related industry in one UK city between 1989 and 2009. Summarise the information by selecting and reporting the main features, and make comparisons where relevant.

The line graph illustrates the number of jobs in tourism-related industry in a particular UK city from 1989 to 2009. Overall, while the number of restaurants showed an overall upward trend, the figures for sport and leisure and travel and tour generally declined, albeit to varying degrees. However, hotels did not change, except of rise […]

See All

Other Topics:

The bar chart illustrates the number of male and female students selecting six major subjects in a university of the US in the year 2010.

The bar chart compares the numbers of male and female students choosing six different university subjects in the US in 2010. Overall, finance was the most popular subject between both genders, while engineering attracted the fewest students. Men were more likely to study economics and mathematics, whereas women showed a greater preference for marketing and […]

The chart shows global sales of the top five mobile phone brands between 2009 and 2013. Summaries the information by selecting and reporting the main features, and make comparisons where revelant.

The line graph illustrates global sales of top five mobile phone brands such as Samsung, Apple, Nokia, LG and ZTE between 2009 and 2013. Overall, the units sold of mobile phone brand Samsung gradually increased while the sales of Nokia significantly decreased. However, the figure of LG and ZTE remained more or less stable whereas […]

The chart below shows the percentage of children in a European country who took part in four kinds of activities in 2009

The chart illustrates the percentage of students in europe who took part in four kinds of activities in 2009. Overall, the students of 12-15 years prefer more bike riding. Meanwhile, the students of age 5-8 and 9-11 attracted to watching tv. The redcomics was the 3rd best activities for the students and playing video game […]

The chart below shows the percentage of children in a European country who took part in four kinds of activities in 2009

The chart illustrates the percentage of students in europe who took part in four kinds of activities in 2009. Overall, the students of 12-15 years prefer more bike riding. Meanwhile, the students of age 5-8 and 9-11 attracted to watching tv. The redcomics was the 3rd best activities for the students and playing video game […]

The chart below shows the market share for different Internet browsers.

The graph illustrates the proportion of market share in four diverse websites (Chrome, Internet Explorer, Firefox, Safari and Opera). Overall, Chrome has the highest proportion of market share in the graph, while Opera has the lowest level of market share. Firstly, the browser Chrome takes first place and it receives 46.40% proportion of the market. […]

The chart below shows the market share for different Internet browsers.

The graph illustrates the proportion of market share in four diverse websites (Crome, Internet Explorer, Firefox, Safari and Opera). Overall, The Chrome has the highest proportion of market share in the grapgh. While Opera has the lowest level of market share Firstly, the browser Chrome takes first place and it recieves 46,40% proportion of the […]

See All
We have detected unusual activity on your device.
Please verify your identity to continue.
Note: This verification step won't sign you in. If you have a premium account, please log in to access the service as usual.
Google/Gmail Verification
Or verify using Email/Code
We've sent a verification code to:
youremail@gmail.com (Not your email?)
Enter it below to complete the verification process.
Ensure your email address is correct, your inbox is not full, and you check your spam folder. If no email arrives, consider using an alternative email.
You will need a Premium plan to perform your action!
Note: If you already have a premium account, please log in to access our services as usual.

Plans & Pricing

Our mission is to make quality education accessible for everyone.
However, to keep our hardworking team running and this service alive, we genuinely need your support!
By opting for a premium plan, not only do you sustain us in achieving the mission, but you also unlock advanced features to enrich your learning experience.

Free

For learners who aren't pressed for time

What's included on Free
100+ Cambridge IELTS Tests
Instant IELTS Writing Task 1 & 2 Evaluation (2 times/month)
Instant IELTS Speaking Part 1, 2, & 3 Evaluation (2 times/month)
Instant IELTS Writing Task 1 & 2 Essay Generator (2 times/month)
500+ Dictation & Shadowing Exercises
100+ Pronunciation Exercises
Flashcards
Other Advanced Tools

Premium

For those serious about advancing their English proficiency, and for IELTS candidates aspiring to boost their band score by 1-2 points (especially in writing & speaking) in just 30 days or less

What's included on Premium
Save Your IELTS Test Progress & Analyze Mistakes By Question Type
Save Your Own Flashcard Sets & Use Them On Any Device
Unlock All Courses, IELTS Tests, Section & Part Practice
Unlimited AI Conversations
Unlimited AI Writing Enhancement Exercises
Unlimited IELTS Writing Task 1 & 2 Evaluation
Unlimited IELTS Speaking Part 1, 2, & 3 Evaluation
Checked Answers Will Not Be Published
Unlimited IELTS Writing Task 1 & 2 Essay Generator
Unlimited IELTS Speaking Part 1, 2, & 3 Sample Generator
Unlimited Usage Of Advanced Tools & AI Features
Priority Support within 24h (12-month plan only)

Due to the nature of our service and the provided free trials, payments are non-refundable.