🔥 Today Only: Save 30% on Premium — Offer Ends Soon! - Upgrade Now!
Bar Chart

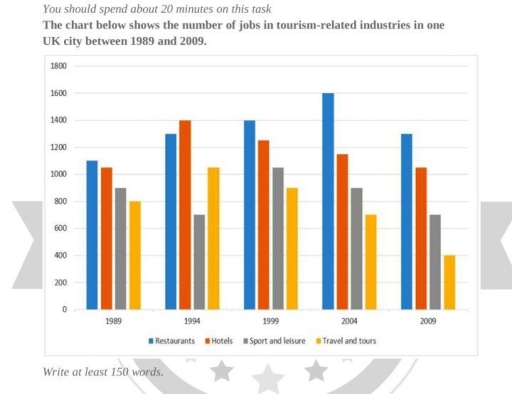
Band 4+: The chart below shows the number of jobs in tourism-related industries in one UK city between 1989 and 2009 Summarise the information by selecting and reporting the main features, and make comparisons where relevant.

Image for topic: The chart below shows the number of jobs in tourism-related industries in one UK city between 1989 and 2009 Summarise the information by selecting and reporting the main features, and make comparisons where relevant.
Our system will evaluate the answer based on this AI-generated description.
The image presents a bar chart depicting the number of jobs in tourism-related industries in a UK city from 1989 to 2009, with separate bars for restaurants, hotels, sport and leisure, and travel and tours for each year. The chart records figures for the years 1989, 1994, 1999, 2004, and 2009. The values for 1989 are as follows: restaurants with approximately 700 jobs, hotels with about 500, sports and leisure with roughly 200, and travel and tours with slightly over 100 jobs. In 1994, the job numbers increase in all sectors with restaurants at approximately 800, hotels around 600, sport and leisure at nearly 500, and travel and tours just above 300. 1999 sees a further rise: restaurants surpassing 900, hotels around 850, sport and leisure close to 750, and travel and tours at 500. In 2004, there is a mixed trend with restaurants reaching almost 1700, hotels over 700, sport and leisure around 850, but travel and tours declines to approximately 400. The final year, 2009, shows a decrease across all industries except for travel and tours which recover to around 600 jobs, while restaurants drop to just over 1400, hotels to 750, and sport and leisure to roughly 550. All trends are illustrated by multiple bars on the y-axis, rising from zero to a maximum of 1800 jobs, with each bar corresponding to a respective industry in the tourism sector.
Given the complexity of the image, the above description may not be entirely accurate.
Note: Both the topic and the answer were created by one of our users.

The given bar chart illustrates the number of four various types of jobs (restaurants, hotels, sport and leisure and travel and tour) in tourim-related industries in one major UK city from 1989 to 2009.

it is evident from tha graph that restaurants was the highest jobs for UK people who loved it. In 1989, it was around 1100, but it was surged and peaked high merely 1600 in 2004, but it was dropped by approximately 1300 in the next year. Furthermore, in 1989, around 1015 people doing jobs in hotels, rosed by 1400 in 1994 and then slightly grew and reach about 1100 and leveled off in the next period.

However, sports and leisure activity was flctuated, starting from 900 and then marginaly decresead 700 and agian peaked 1015 and then fell around 700 in 2009. Similarly, travel and tour jobs starting from 800 to increased 1015 and then continusely falling down and reached least 400 jobs in 2009.

overall,it can be stated that the maximum jobs available in reastaurants and hotels,while people least intrested on sports and leisure and travel and tour.

Word Count: 183

Answers On The Same Topic:

The chart below shows the number of jobs in tourism-related industries in one UK city between 1989 and 2009 Summarise the information by selecting and reporting the main features, and make comparisons where relevant.

The bar chart compares the amount of employment opportunities in tourism-related industries in a UK city between 1989 and 2009. Overall, there are 4 categories of tourism-related industries: Restaurants, Hotels, Sport and leisure, and Travel and tours. Restaurant and hotels offered the most jobs compared to sport and leisure or travel and tours. The first […]

The chart below shows the number of jobs in tourism-related industries in one UK city between 1989 and 2009 Summarise the information by selecting and reporting the main features, and make comparisons where relevant.

: The given bar graph compares data about the range of job opportunities in the field of tourism in a UK city from 1989 to 2009. Overall, it can be seen that restaurants were the most popular sector among all the other industries throughout the given period, while travel and tours offered the fewest positions […]

The chart below shows the number of jobs in tourism-related industries in one UK city between 1989 and 2009 Summarise the information by selecting and reporting the main features, and make comparisons where relevant.

The bar chart illustrates the number of jobs related industries (Restaurants, Hotels, Sport and leisure, Travel and tours) in one UK’s urban areas over a twenty- year period between 1989 and 2009. Overall, the restaurants saw remarkable rise, travel and tours witnessed a steady decrease while hotels increased and sport and leisure experienced fluctuation over […]

The chart below shows the number of jobs in tourism-related industries in one UK city between 1989 and 2009 Summarise the information by selecting and reporting the main features, and make comparisons where relevant.

The given bar chart compares the number of jobs in tourism-related industries in a particular city in UK from 1989 to 2009. In general, Uk consistently had the highest number of restaurants, except in 1994, whereas the opposite case was true for travel tours, which recorded lowest number of jobs, with the exception of 1994. […]

See All

Other Topics:

The chart below shows the donations given to six different types of charity by one company from 2012 to 2014. Summarize the information by selecting and reporting the main features, and make comparisons where relevant.

The triple column chart demonstrated the donation given to six distinct categories of charity by one company from 2012 to 2014. Social welfare charity had the supreme amount of donation during this period of time, while art charity had the minimum contribution out of 6 categories. The common inclination of this chart is decreased through […]

The chart below shows library borrowing in UK public libraries during a 10-year period from 1995 to 2005. Summarise the information by selecting and reporting the main features, and make comparisons where relevant.

The bar charts give information about how many books were borrowed (in millions) from the library of the UK between 1995 and 2005. Overall, all four category books were popular among readers in 1995, however, the number of books which is borrowed decreased dramatically by 2005. In addition, the figure for adult non-fiction books showed […]

The graph below shows the numbers of three types of visitors to a museum between 1997 and 2012. Summarise the information by selecting and reporting the main features, and make comparisons where relevant.

The bar chart illustrates data about the proportion of three types of visitors to a museum from 1997 to 2012. There are adults, individuals aged under 15, and special exhibition visitors. Overall, it is clear that adult visitors dominated the most proportion throughout the period. In addition, tourists who aged under 15 consistently decreased over […]

The chart below shows the percentages of Internet users in different activities in a UK city in 2007 and 2009.

The given bar chart illustrates the percentages o f online users involved in various activities in a UK city in 2007 and 2009. Overall, shopping consistently represented the largest share of activities in both years, while TV had the smallest. Most activities increased from 2007 to 2009, except for books and learning, which declined. Shopping […]

The chart below shows the number of jobs in tourism-related industry in one UK city between 1989 and 2009

The chart compares the total number of jobs in tourism industries in UK between 1989 and 2009. Overall, it can be seen clearly from the chart the figure for restaurants experienced dramatic growth throughout the period, while both hotels, sport and leisure have fluctuated over the timeframe. Meanwhile, number of travel and tour declined. Initially, […]

See All
We have detected unusual activity on your device.
Please verify your identity to continue.
Note: This verification step won't sign you in. If you have a premium account, please log in to access the service as usual.
Google/Gmail Verification
Or verify using Email/Code
We've sent a verification code to:
youremail@gmail.com (Not your email?)
Enter it below to complete the verification process.
Ensure your email address is correct, your inbox is not full, and you check your spam folder. If no email arrives, consider using an alternative email.
You will need a Premium plan to perform your action!
Note: If you already have a premium account, please log in to access our services as usual.

Plans & Pricing

Our mission is to make quality education accessible for everyone.
However, to keep our hardworking team running and this service alive, we genuinely need your support!
By opting for a premium plan, not only do you sustain us in achieving the mission, but you also unlock advanced features to enrich your learning experience.

Free

For learners who aren't pressed for time

What's included on Free
100+ Cambridge IELTS Tests
Instant IELTS Writing Task 1 & 2 Evaluation (2 times/month)
Instant IELTS Speaking Part 1, 2, & 3 Evaluation (5 times/month)
Instant IELTS Writing Task 1 & 2 Essay Generator (2 times/month)
500+ Dictation & Shadowing Exercises
100+ Pronunciation Exercises
Flashcards
Other Advanced Tools

Premium

For those serious about advancing their English proficiency, and for IELTS candidates aspiring to boost their band score by 1-2 points (especially in writing & speaking) in just 30 days or less

What's included on Premium
Save Your IELTS Test Progress
Unlock All Courses & IELTS Tests
Unlimited AI Conversations
Unlimited AI Writing Enhancement Exercises
Unlimited IELTS Writing Task 1 & 2 Evaluation
Unlimited IELTS Speaking Part 1, 2, & 3 Evaluation
Checked Answers Will Not Be Published
Unlimited IELTS Writing Task 1 & 2 Essay Generator
Unlimited IELTS Speaking Part 1, 2, & 3 Sample Generator
Unlimited Usage Of Advanced Tools
Priority Support within 24h (12-month plan only)

Due to the nature of our service and the provided free trials, payments are non-refundable.
Nếu bạn là người Việt Nam và không có hoặc không muốn trả bằng credit/debit cards, bạn có thể thanh toán bằng phương thức chuyển khoản:


Chọn gói:
419,000₫ 277,000 ₫ cho gói 1 tháng (chỉ 9,233₫/ngày)
1,239,000₫ 597,000 ₫ cho gói 3 tháng (chỉ 6,633₫/ngày)
2,469,000₫ 1,027,000 ₫ cho gói 6 tháng (chỉ 5,706₫/ngày)
4,929,000₫ 1,417,000 ₫ cho gói 12 tháng (chỉ 3,936₫/ngày)


Sau khi chuyển khoản, vui lòng đợi trình duyệt tự động điều hướng bạn trở lại Engnovate và bạn sẽ ngay lập tức nhận được mã kích hoạt tài khoản premium.
Nếu có lỗi xảy ra, bạn có thể liên hệ với team thông qua một trong các phương thức: email đến helloengnovate@gmail.com hoặc nhắn tin qua facebook.com/engnovate.
Vì toàn bộ công cụ trên website đều có thể sử dụng thử miễn phí, Engnovate không hỗ trợ hoàn tiền.