Our system will evaluate the answer based on this AI-generated description.
The image contains two bar graphs comparing the number of male and female students in full-time and part-time education across three academic years. For males in 1970/71, there were about 275 in part-time and 900 in full-time education. In 1980/81, males increased to approximately 325 in part-time and 975 in full-time education. By 1990/91, males in part-time education rose to around 400, and full-time education to 1100. For females in 1970/71, part-time education had about 225 students, and full-time had nearly 1150. In 1980/81, females in part-time education went up to roughly 350, and full-time to nearly 1250. In 1990/91, females in part-time education surged to about 475, and full-time education to around 1350. The trend for both genders indicates growth in both full-time and part-time education over the 20-year span, with females outnumbering males in full-time education, and the gap between genders in full-time education increasing over time.
Given the complexity of the image, the above description may not be entirely accurate.
Skyrocket your IELTS band score by 1-2 points in under a month with our premium plan!
Note: Both the topic and the answer were created by one of our users.
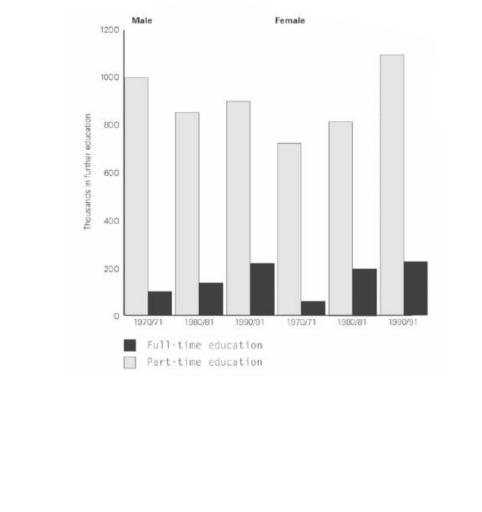
The following bar graph illustrates the number of men and women in part-time and full-time education in Britain during the late 1900s. It is a comparative study that was conducted from the 1970s to the 1990s.
The trend of part-time education in men was mostly stable. Initially, it was 1000 in the 1970s, a meagre fall was observed and then rose to nearly 900 in the 1990s. The full-time education graph of men showcased a steady growth of a mere 100 to 200 in the 1990s. Consequently, it resulted in a positive jump in male education.
On the contrary female part-time education gained gracefully. With just 700 in the 1970s, it shot up to 1200 in the 1990s. It surpassed the men’s graph with a whopping 200. The full-time education in females was at an all-time low in the 1970s, but a huge jump was observed in the later years by catching up with the men in the 1990s.
There is fluctuation observed in the graphs of men, but no decline was observed in the case of females. Following the graph there might even be a time when women surpass men in education.
Word Count: 193
