Our system will evaluate the answer based on this AI-generated description.
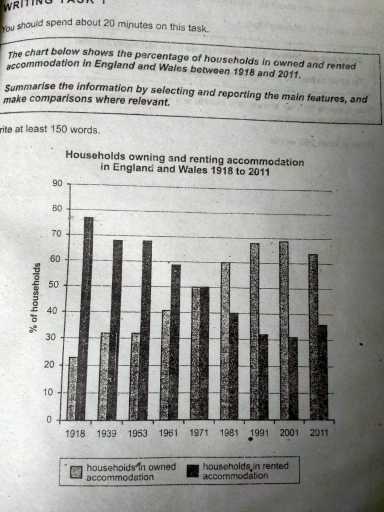
The image displays a bar chart comparing the percentage of households owning versus renting accommodation in England and Wales from 1918 to 2011. The chart presents data for the years 1918, 1933, 1953, 1961, 1971, 1981, 1991, 2001, and 2011. In 1918, 23% of households owned and 77% rented. The figures for 1933 are 32% owned and 68% rented. In 1953, ownership increased to 42% while renting decreased to 58%. The 1961 data shows a slight increase in ownership at 47% and a decrease in renting at 53%. The trend continues in 1971 with a majority of 51% owning homes and 49% renting. In 1981, the gap widens with 59% owning and 41% renting. The 1991 data shows 67% ownership and 33% rental. The 2001 figures report 69% ownership and 31% rental. The 2011 data marks a slight decrease in ownership at 64% and an increase in rental accommodation at 36%.
Given the complexity of the image, the above description may not be entirely accurate.
Skyrocket your IELTS band score by 1-2 points in under a month with our premium plan!
Note: Both the topic and the answer were created by one of our users.
The given bar chart illustrates the rate of households in two different accommodation in England and Wales from 1918 to 2011.
Overall, it is obvious that the percentage of households in ranted accommodation showed an upward trend, while the proportion of households in accommodation in owned experience a downward trend throughout the period.
At the beginning of the period, the households in owned accommodation was almost 24% in 1918, and then it rose to more than 30% in 1939. after the figure remained stable until 1963.However, there was a rapid increase to approximately 68% in the year 2001. subsequently, it go down to 35% at the end of the period, which outraced the rate of households in ranted. In contrast, the percentage of households in rented was around 78% in 1918, which was higher than the proportion of households in owned by about 55%, then it dropped to almost 68% in the year 1939. However, the figure remained constant in 1963 after that, which showed a sharp decrease to almost 32% in 1991 and continued to go down steadily in 2001, and then the figure there was a slight growth of 4% at the end of the period.
Word Count: 198
