Our system will evaluate the answer based on this AI-generated description.
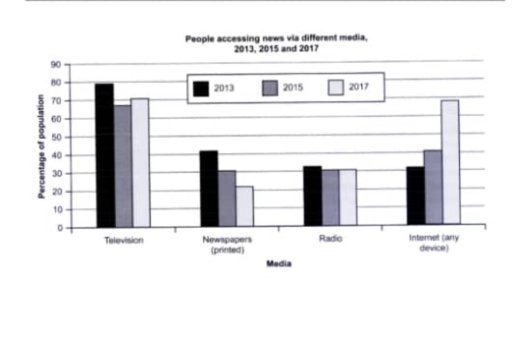
The image displays a bar graph titled "People accessing news via different media, 2013, 2015 and 2017" with the y-axis representing "Percentage of population" ranging from 0 to 90 in increments of 10, and the x-axis denotes "Media" divided into "Television," "Newspapers (printed)," "Radio," and "Internet (any device)." Each media category contains three bars corresponding to the years 2013, 2015, and 2017. In 2013, Television has the highest percentage at approximately 85, Newspapers follows with roughly 35, Radio is near 25, and Internet usage is around 30. In 2015, Television sees a slight decrease to just under 85, Newspapers drop to nearly 25, Radio remains constant at about 25, and Internet use increases to approximately 40. In 2017, Television decreases further to around 82, Newspapers continue to fall to about 18, Radio stays steady at 25, and Internet usage surges to around 70.
Given the complexity of the image, the above description may not be entirely accurate.
Skyrocket your IELTS band score by 1-2 points in under a month with our premium plan!
Note: Both the topic and the answer were created by one of our users.
The provided chart illustrates the percentage of the population accessing news through various media channels in a specific country between 2013 and 2017. Overall, there was a noticeable shift in news consumption habits during this period, with a decline in traditional media and a significant rise in online news consumption.
In terms of traditional media, both television and newspaper usage experienced a downward trend. While television viewership decreased slightly in 2015, it rebounded marginally in 2017. Newspaper readership, however, continued to decline throughout the period. Radio usage remained relatively stable, fluctuating around the 30% mark.
In stark contrast, internet usage surged dramatically. It increased by over 35%, peaking at nearly 70% in 2017. This indicates a clear preference for online news sources among the population.
Word Count: 125
