Our system will evaluate the answer based on this AI-generated description.
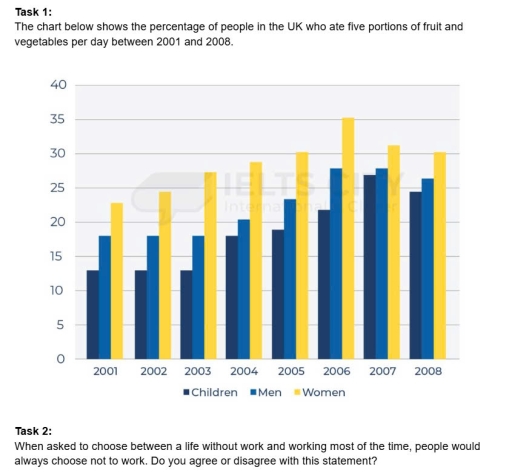
The image shows Task 1 with a bar chart depicting the percentage of individuals in the UK consuming five portions of fruits and vegetables daily from 2001-2008, broken down by Children, Men, and Women. In 2001, Children approx. 18%, Men approx. 14%, Women approx. 23%. In 2002, Children approx. 20%, Men approx. 16%, Women approx. 25%. In 2003, Children approx. 22%, Men approx. 18%, Women approx. 27%. In 2004, Children approx. 24%, Men approx. 20%, Women approx. 28%. In 2005, Children approx. 26%, Men approx. 22%, Women approx. 30%. In 2006, Children approx. 28%, Men approx. 24%, Women approx. 32%. In 2007, Children approx. 30%, Men approx. 26%, Women approx. 34%. In 2008, Children approx. 32%, Men approx. 28%, Women approx. 36%. Task 2 presents a statement about choosing between life without work and working most of the time, questioning agreement.
Given the complexity of the image, the above description may not be entirely accurate.
Skyrocket your IELTS band score by 1-2 points in under a month with our premium plan!
Note: Both the topic and the answer were created by one of our users.
The bar graph illustrates the relative percentage of healthy food eaters thoughout the three main groups of people in the United Kingdom from 2001 to 2008.
Over the whole time period, the women group was the most careful domain, who preferred a well-balanced diet. Team which ruled by men werepractically the same as those that made from children. A similar pattern for each branch,which had been represented by upward trend reached the peak in 2006-2007 but then it slumped.
In 2001, women, who used to good nutriton, had the lowest percentage in the bar throughout the whole chart, the nadir was around 23%. However, it had upward to 35% in 2006 and fractionally fell down by 5% for the 2008. The man sector, on the other hand, had huge similarities with youth category.The situations in both cllasifications remained stable between 2001 and 2003, then its percentage jumped from 20% to 28% and culmitated in 2006.By 2008 it didn’t have a significant changes.
The amount of people who preferred nutrient dense food grew marginally from average percentage , as 17% in 2001 to exactly a quarter in 2006 then remained the static for the next two years.
Word Count: 196
