Our system will evaluate the answer based on this AI-generated description.
The image consists of a line graph titled "River Water Quality in the UK," depicting the percentage of river water with good chemical quality from 1990 to 2002 across four regions: Wales, Northern Ireland, England, and Scotland. In 1990, Wales had 75%, Northern Ireland had 45%, England had 70%, and Scotland had 80%; in 1992, Wales had 75%, Northern Ireland had 45%, England had 65%, and Scotland had 85%; in 1994, Wales had 85%, Northern Ireland had 45%, England had 75%, and Scotland had 90%; in 1996, Wales had 85%, Northern Ireland had 65%, England had 85%, and Scotland had 85%; in 1998, Wales had 90%, Northern Ireland had 45%, England had 85%, and Scotland had 85%; in 2000, Wales had 95%, Northern Ireland had 55%, England had 85%, and Scotland had 85%; in 2002, Wales had 95%, Northern Ireland had 65%, England had 90%, and Scotland had 80%.
Given the complexity of the image, the above description may not be entirely accurate.
Skyrocket your IELTS band score by 1-2 points in under a month with our premium plan!
Note: Both the topic and the answer were created by one of our users.
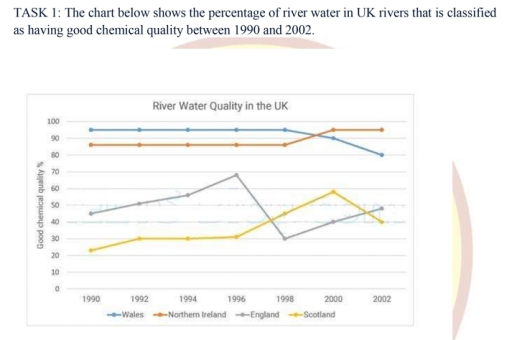
The line graph illustrates the proportion of river water in four UK regions deemed to have good chemical quality between 1990 and 2002.
Overall, rivers in Wales and Northern Ireland consistently exhibited the highest chemical quality, despite a divergence at the end of the period. In contrast, England and Scotland recorded lower and more variable percentages throughout.
In Wales, around 95% of river samples met good chemical standards in 1990, peaking at approximately 98% in 1997 before declining to about 80% by 2002. Northern Ireland began at 83% in 1990, rose steadily to reach 88% in 1998, then climbed sharply to 100% in 2000, and dipped slightly to finish at 96% in 2002.
By comparison, England’s waterways started at just 45% good quality in 1990 and improved to a high of 70% in 1996, only to plummet to 30% in 1998; they then recovered moderately to reach 50% by 2002. Scotland showed a similar pattern of fluctuation: beginning at 22% in 1990, rising to around 30% through the mid-1990s, surging to 60% in 2000, and falling back to 40% by 2002.
Word Count: 181