Our system will evaluate the answer based on this AI-generated description.
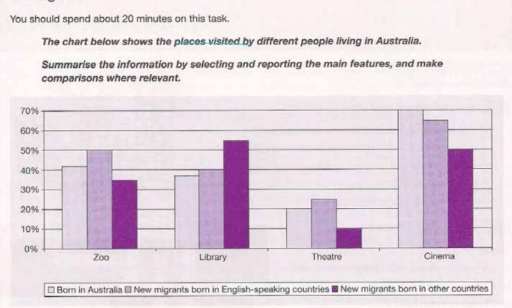
The image shows a bar graph with four categories: Zoo, Library, Theatre, and Cinema, with three different groups represented: Born in Australia, New migrants born in English-speaking countries, and New migrants born in other countries. For the Zoo category, Born in Australia group is around 28%, New migrants born in English-speaking countries is around 25%, and New migrants born in other countries is around 20%. For the Library category, Born in Australia group is around 45%, New migrants born in English-speaking countries is around 40%, and New migrants born in other countries is around 35%. For the Theatre category, Born in Australia group is around 25%, New migrants born in English-speaking countries is around 15%, and New migrants born in other countries is around 10%. For the Cinema category, Born in Australia group is around 65%, New migrants born in English-speaking countries is around 48%, and New migrants born in other countries is around 55%. The graph shows that the Born in Australia group consistently has a higher percentage in all categories.
Given the complexity of the image, the above description may not be entirely accurate.
Skyrocket your IELTS band score by 1-2 points in under a month with our premium plan!
Note: Both the topic and the answer were created by one of our users.
The chart gives information about the types of vacation in three categories in Australia in a particular year.
Overall, cinema is the most preferable type leisure time activity among Australian native people and new arrivals who can speak English. New migrants from other nations opt for spend time in library. Mostly residents in Australia prefer to watch movies in theri free time.
Focusing on the a couple of trends which are almost no disparity. The percentage of original Australians who visit to zoos and theatre accounted for just over 40% and 20%. English-speaking migrants were 50% and a half of it in that category. Zoos were came by non-English were approximately a third, while 10% for theatre.
When it comes to other other figures, the proportion of Australian-born people and humans who can speak English prefer reading books constituted almost the same at almost 40%. New migrants made up approximately a half. Furthermore, 70% of non-migrants opt for cinema, the figure for Englishmen were 65% and 50% of non-native individuals like to watch movies
Word Count: 174
