🔥 Today Only: Save 30% on Premium — Offer Ends Soon! - Upgrade Now!
Bar Chart

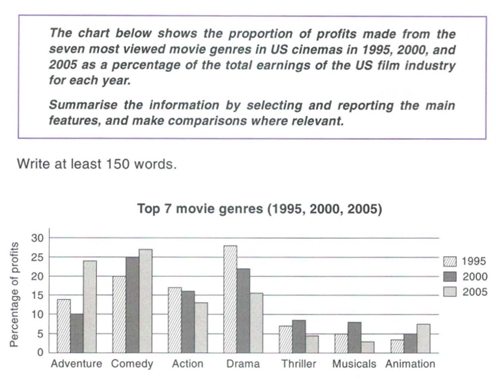
Band 5+: The chart below shows the proportion of profits made from the seven most viewed movie genres in US cinemas in 1995, 2000, and 2005 as a percentage of the total earnings of the US film industry for each year.

Image for topic: The chart below shows the proportion of profits made from the seven most viewed movie genres in US cinemas in 1995, 2000, and 2005 as a percentage of the total earnings of the US film industry for each year.
Our system will evaluate the answer based on this AI-generated description.
The image displays a bar chart comparing the profit percentages of the top 7 movie genres in US cinemas for the years 1995, 2000, and 2005. It includes the following genres: Adventure, Comedy, Action, Drama, Thriller, Musicals, and Animation. In 1995, the adventure genre earned around 25%, comedy roughly 19%, action about 23%, drama approximately 11%, thriller near 18%, musicals about 9%, and animation around 3%. In 2000, adventure decreased to about 20%, comedy increased slightly to around 21%, action dropped to nearly 18%, drama rose marginally to around 12%, thriller decreased to about 12%, musicals increased to around 14%, and animation rose significantly to about 13%. By 2005, adventurous increased to over 25%, comedy decreased to about 18%, action fell to around 15%, drama increased to about 18%, thriller rose slightly to about 9%, musicals dropped to around 6%, and animation skyrocketed to roughly 18%.
Given the complexity of the image, the above description may not be entirely accurate.
Note: Both the topic and the answer were created by one of our users.

The bar chart provides data on the proportion of net income made from the seven most watched movie genres in US cinemas in 1995, 2000 and 2005 as percentage of total earnings of the US film industry for each year.

Generally, what stands out from the chart is that the profit made from all the genres was fluctuated over the years. Adventure, Comedy was the two genres, which made more money than they did the previous years.

In 1995, roughly 28% of the profits was made from Drama, making it the most valuable movie genre of the year. Comedy is the second most valuable genre, followed by Action. Adventure was close behind at roughly 14%, which nearly equal to the profit of the three least profitable genres combined. However, Comedy surpassed Drama to be the most profitable at 25%. Adventure is the genre that had the most increase of the year. A similar pattern was seen in Comedy and Animation. Other genres experienced a downward trend.

Word Count: 166

Answers On The Same Topic:

The chart below shows the proportion of profits made from the seven most viewed movie genres in US cinemas in 1995, 2000, and 2005 as a percentage of the total earnings of the US film industry for each year.

The provided bar chart illustrates the profit percentages derived from the seven most popular movie genres in US cinemas during the years 1995, 2000, and 2005, expressed as a share of the total earnings of the US film industry. Overall, the data reflects noticeable fluctuations in the profit contributions from various genres over the specified […]

The chart below shows the proportion of profits made from the seven most viewed movie genres in US cinemas in 1995, 2000, and 2005 as a percentage of the total earnings of the US film industry for each year.

The given bar chart illustrates the proportion of profits generated by seven major film genres in US cinemas between 1995 and 2005. Overall, the profit shares of these genres followed diverse trends, with Comedy emerging as the largest contributor in most years. Meanwhile, only three genres—Comedy, Adventure, and Animation—showed consistent growth throughout the period. In […]

The chart below shows the proportion of profits made from the seven most viewed movie genres in US cinemas in 1995, 2000, and 2005 as a percentage of the total earnings of the US film industry for each year.

The given bar chart illustrates the profit rate of seven different most favoured types of films in US cinemas from 1995 to 2005. Overall, these film genres followed various trajectories with comedy being the largest contributor in most surveyed years. Meanwhile, there were only 3 types of films whose profit rate increased across the timeframe, […]

The chart below shows the proportion of profits made from the seven most viewed movie genres in US cinemas in 1995, 2000, and 2005 as a percentage of the total earnings of the US film industry for each year.

The given bar chart illustrates the percentages of earnings of the top seven U.S. movie genres—Adventure, Comedy, Action, Drama, Thriller, Musicals, and Animation—in 1995, 2000, and 2005. Overall, what stands out from the chart is that the proportion of profits made from Adventure, Comedy, Action, and Drama was much higher than that from the three […]

The chart below shows the proportion of profits made from the seven most viewed movie genres in US cinemas in 1995, 2000, and 2005 as a percentage of the total earnings of the US film industry for each year.

The given bar chart illustrates the percentages of earnings of the top seven US movie genres—Adventure, Comedy, Action, Drama, Thriller, Musicals, and Animation—in 1995, 2000, and 2005. Overall, what stands out from the chart is that the proportion of profits made from Adventure, Comedy, Action, and Drama was much higher than that from the three […]

See All

Other Topics:

the percentage contribution of the IT and service industries to the GDP

The given data displayed features of the UK’s GDP between 1992 and 2000. Overall, IT industry percentage of GDP throughout entire graph always take the highest position in all possible that’s bar chart time periods.Meanwhile, both of service industry and IT industry increased. To begin, IT industry started fluctuated in 1992 from just over 6 […]

The chart below shows waste collection by a recycling centre from 2011 to 2015.

The bar chart illustrates the amount of garbage collected by a recycling facility over a five-year period from 2011 to 2015. Overall, all four categories showed an upward trend, albeit to varying degrees. Notably, the amount of paper waste experienced the most significant increase throughout the period, whereas the figures for glass, tins and garden […]

The type of media that people of different age groups used to get daily news in one country in 2011.

The graph illustrates the percentage of the type of media that people of different age groups used to get dily news in one country in 2011. There is 5 age groups and 3 types of ways of getting news. Overall, it is clear that as the age became older then the percent of all three […]

The chart below shows the number of men and women in further education in Britain in three periods and whether they were studying full-time or part-time. Summarise the information by selecting and reporting the main features and make comparisons where relevant.

The chart illustrates the amount of male and female people in further education in the UK in three timelines and whether they were studying full-time or part-time. Overall, it is clear that females’ number in full-time in the latest period was higher than males’. In Contrast, other figures of full-time education were higher than females’. […]

The graph shows changes in meat production worldwide between 2010 and 2020.Summarise the information by selecting and reporting the main features, and make comparisons where relevant.

The diagram illustrates differences in meat production worldwide between 2010 and 2020. Overall, in this chart the most popular meat type is pork and beef, while sheep meat is least popular. Beef increased and dominated constantly 8 years, while poultry increased significantly only in 2020. In 2010, Beef had the highest production, maintaining 25 million […]

The chart below shows the destinations of students graduating from Physics and from Arts Design in one European country in 2007. Summarize the information by selecting and reporting the main features, and make comparisons where relevant. Write at least 150 words.

The chart illustrates the destinations of scholars advancing from Physics and from Arts and Design in one European country in a given year (2007). Overall, the majority of the pupils after graduating with Arts and Design are likely to get employed immediately, while in the case of Physics, many students are rather also focusing on […]

See All
We have detected unusual activity on your device.
Please verify your identity to continue.
Note: This verification step won't sign you in. If you have a premium account, please log in to access the service as usual.
Google/Gmail Verification
Or verify using Email/Code
We've sent a verification code to:
youremail@gmail.com (Not your email?)
Enter it below to complete the verification process.
Ensure your email address is correct, your inbox is not full, and you check your spam folder. If no email arrives, consider using an alternative email.
You will need a Premium plan to perform your action!
Note: If you already have a premium account, please log in to access our services as usual.

Plans & Pricing

Our mission is to make quality education accessible for everyone.
However, to keep our hardworking team running and this service alive, we genuinely need your support!
By opting for a premium plan, not only do you sustain us in achieving the mission, but you also unlock advanced features to enrich your learning experience.

Free

For learners who aren't pressed for time

What's included on Free
100+ Cambridge IELTS Tests
Instant IELTS Writing Task 1 & 2 Evaluation (2 times/month)
Instant IELTS Speaking Part 1, 2, & 3 Evaluation (2 times/month)
Instant IELTS Writing Task 1 & 2 Essay Generator (2 times/month)
500+ Dictation & Shadowing Exercises
100+ Pronunciation Exercises
Flashcards
Other Advanced Tools

Premium

For those serious about advancing their English proficiency, and for IELTS candidates aspiring to boost their band score by 1-2 points (especially in writing & speaking) in just 30 days or less

What's included on Premium
Save Your IELTS Test Progress & Analyze Mistakes By Question Type
Save Your Own Flashcard Sets & Use Them On Any Device
Unlock All Courses, IELTS Tests, Section & Part Practice
Unlimited AI Conversations
Unlimited AI Writing Enhancement Exercises
Unlimited IELTS Writing Task 1 & 2 Evaluation
Unlimited IELTS Speaking Part 1, 2, & 3 Evaluation
Checked Answers Will Not Be Published
Unlimited IELTS Writing Task 1 & 2 Essay Generator
Unlimited IELTS Speaking Part 1, 2, & 3 Sample Generator
Unlimited Usage Of Advanced Tools & AI Features
Priority Support within 24h (12-month plan only)

Due to the nature of our service and the provided free trials, payments are non-refundable.