Our system will evaluate the answer based on this AI-generated description.
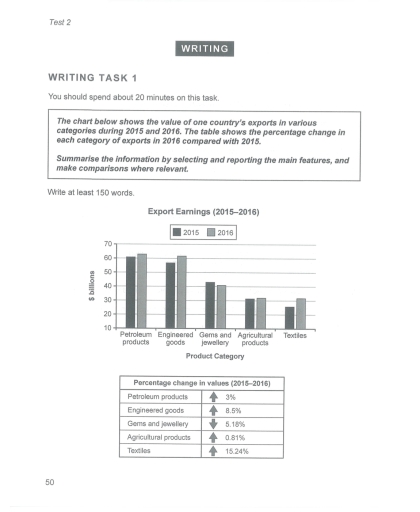
The image displays export earnings data from 2015 to 2016 for five product categories: Petroleum products, Engineered goods, Gems and jewelry, Agricultural products, and Textiles. In 2015, Petroleum products earned approximately $61 billion, increasing to about $63 billion in 2016. Engineered goods rose from $58 billion in 2015 to around $61 billion in 2016. Gems and jewelry decreased from $43 billion in 2015 to approximately $41 billion in 2016. Agricultural products saw an increase from $31 billion in 2015 to about $32 billion in 2016. Textiles increased from $25 billion in 2015 to approximately $28 billion in 2016. The percentage change table shows: Petroleum products with a 3% increase, Engineered goods with an 8.5% increase, Gems and jewelry with a 5.18% decrease, Agricultural products with a 0.81% increase, and Textiles with a 15.24% increase.
Given the complexity of the image, the above description may not be entirely accurate.
Skyrocket your IELTS band score by 1-2 points in under a month with our premium plan!
Note: Both the topic and the answer were created by one of our users.
The bar chart compares a nation’s export values across sectors between 2015 and 2016, and the table provides the percentage changes in exports for each sector over the same period.
Overall, export earnings increased for most sectors, with petroleum products consistently leading in export value across both years.
The textiles sector experienced the most significant growth in percentage terms. Petroleum products, the dominant export, experienced a 3% increase, suggesting stable international demand. Engineered goods also contributed significantly, with exports increasing by 8.5% suggesting growth in that sector.
The textiles sector demonstrated considerable expansion, experiencing a 15.24% surge, indicating a noteworthy positive shift in export earnings, possibly driven by increased global demand Gems and jewelry was only sector to experience a decline, decreasing by 5.18%, which could be attributed to changing market dynamics or economic factors. These shifts highlight key trends in the nation’s export economy.
Word Count: 145
