Our system will evaluate the answer based on this AI-generated description.
The image shows a line graph illustrating the percentage of tourists to Scotland who visited different attractions from 1980 to 2010. The graph has four lines representing the Aquarium (blue), Castle (red), Zoo (yellow), and Festival (purple) attractions. In 1980, the castle had the highest percentage of visitors at approximately 30%, followed by the festival at around 25%, the aquarium at 20%, and the zoo at 15%. By 1985, the castle and festival were both around 35%, the aquarium at 25% and the zoo at 20%. In 1990 the trend remained similar to 1985. By 1995, the castle reached its peak at 45%, while the festival saw a slight decrease to 30%, the aquarium remained steady at 25%, and the zoo dropped to 15%. In 2000, the castle had a slight dip to just below 45%, the festival increased to nearly 35%, the aquarium rose to 30%, and the zoo remained at 15%. In 2005, the castle decreased to around 40%, the festival went up to 40%, the aquarium stayed at 30%, and the zoo had a slight increase to just over 15%. By 2010, the castle was at 40%, the festival decreased to 35%, the aquarium slightly increased to just above 30%, and the zoo went up to just below 20%.
Given the complexity of the image, the above description may not be entirely accurate.
Skyrocket your IELTS band score by 1-2 points in under a month with our premium plan!
Note: Both the topic and the answer were created by one of our users.
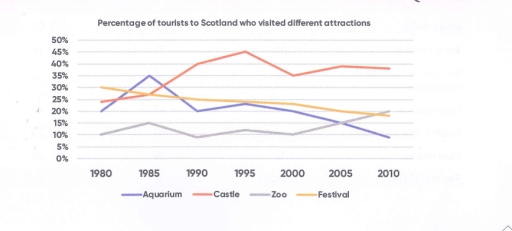
The line graph illustrates how many travellers visited four different types of attractions, namely Aquarium, Castle, Zoo and Festival in Scotland between 1980 and 2010.
Overall, there was an increase in the number of tourists visiting Castle and Zoo, while the opposite was true for Festival and Aquarium attractions. It was also notable that Castle was the most attractive place for people to visit in Scotland almost the period.
As can be seen in the chart, the percentage of visitors who went to Castle started at about 22% in 1980, after which it experienced a significant rise to approximately 45% in 1995, before decreasing slightly by 10% (at about 35%) in the next fifteen years. An opposite change can be seen in the figure for Festival attraction, which dropped gradually from 30% in the first year to roughly 18% in the last year of the period.
Regarding the remaining attractions, about 20% of visitors can be seen in the figure for Aquarium in 1980, with a marginal growth to reach a peak at 35% and a sharp decline to just under 10% thirty years later. Meanwhile, the proportion of tourists who visited to Zoo saw an opposite change, hovering between 10% and 15% during the first twenty years, followed by a moderate increase to exactly 20% at the end of the period.
Word Count: 222