Our system will evaluate the answer based on this AI-generated description.
The image shows two graphs about education levels in Glasgow in 2010: a bar chart displaying education levels by age range and a pie chart showing education levels by gender. In the bar chart, for the 16-24 age range, 9% have a university degree, 71% have a school certificate, and 20% have no qualifications; for 24-35, 15% have a degree, 76% have a certificate, and 9% have no qualifications; for 35-50, 20% have a degree, 71% have a certificate, and 9% have no qualifications; for 50-75, 20% have a degree, 50% have a certificate, and 30% have no qualifications; for 75+, 3% have a degree, 25% have a certificate, and 72% have no qualifications. In the pie chart, for women, 38% have a degree, 29% have a certificate, and 33% have no qualifications, while for men, 35% have a degree, 32% have a certificate, and 33% have no qualifications.
Given the complexity of the image, the above description may not be entirely accurate.
Skyrocket your IELTS band score by 1-2 points in under a month with our premium plan!
Note: Both the topic and the answer were created by one of our users.
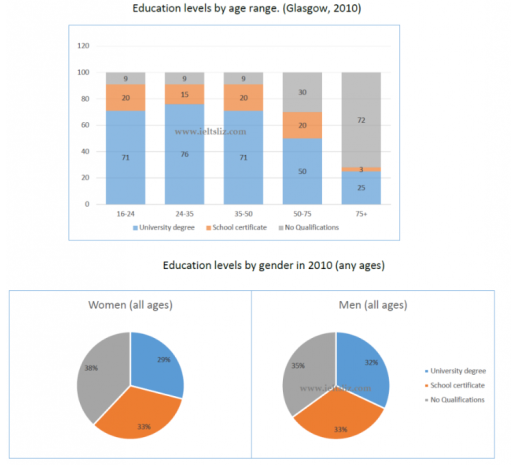
The charts below illustrates the information about 3 levels of education ( school certificate, university degree and no qualification) in Glasgow, a city in Scotland, in 2010.
Overall, the younger generation’s education level is higher than the older generation. In additionally if we compare women and men of all ages, according to the pie charts men have more qualification than women.
If we look at age 16-24 group and 24-35 group, age 16-24 group has more school certificate qualification, but age 24-35 group as more university degree qualification.
The way of qualification distributed pattern of age 16-24 group and age 35-50 group are exactly simillar.
When it comes to the 75+ range people with school certificate qualification are rare to find, but the people with a university degree are more tend to find. The individuals from 50-75 has less university degree accomplishment than the 16-50, but it is higher than the 75+ older people. This charts depicts clear data.
Word Count: 159