Our system will evaluate the answer based on this AI-generated description.
The image shows two graphs about education levels in Glasgow in 2010: a bar chart displaying education levels by age range and a pie chart showing education levels by gender. In the bar chart, for the 16-24 age range, 9% have a university degree, 71% have a school certificate, and 20% have no qualifications; for 24-35, 15% have a degree, 76% have a certificate, and 9% have no qualifications; for 35-50, 20% have a degree, 71% have a certificate, and 9% have no qualifications; for 50-75, 20% have a degree, 50% have a certificate, and 30% have no qualifications; for 75+, 3% have a degree, 25% have a certificate, and 72% have no qualifications. In the pie chart, for women, 38% have a degree, 29% have a certificate, and 33% have no qualifications, while for men, 35% have a degree, 32% have a certificate, and 33% have no qualifications.
Given the complexity of the image, the above description may not be entirely accurate.
Skyrocket your IELTS band score by 1-2 points in under a month with our premium plan!
Note: Both the topic and the answer were created by one of our users.
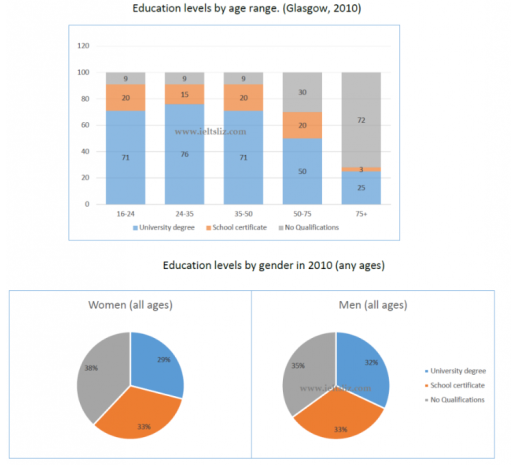
The charts illustrate information on education levels in Glasgow city in 2010. the graphs depict education levels characterising by age range and by gender.
Overall, the avarage educational level of the elder people are lower than younger individuals. Regarding to figures, both of genders have similar indicators.
Firstly, no qualification education level’s age range from 16 to 50 were all 9%. However, the rate of university degree holders and school certificate holders in 20% in the 16-24 and 35-50 age range and 15% in the 24-35 age range. University degree education level changes between 71-76% in the ages of 16-50, and the highest level in 24-35 ages by 76%. turning to the older generations number of university degree education level decreasing from 50% to 25%, school certification level from 20% to 3% in the age range of 50-75 and 75 plus. In this age range only no qualifications had upward trend between 30% and 72%.
Observing the pie charts in detail, it is apparent that the proportions of individuals with school certificates were the same in the case of both male and female, with 33% each.
Word Count: 186
