🔥 Today Only: Save 30% on Premium — Offer Ends Soon! - Upgrade Now!
Multiple Graphs

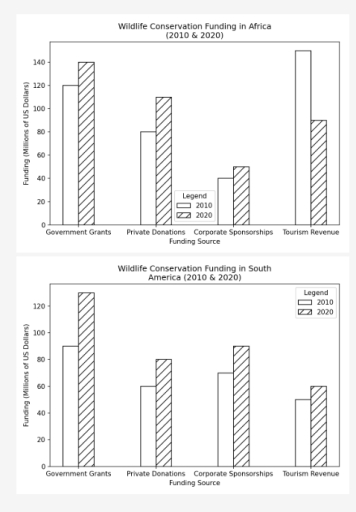
Band 8+: The charts below show the main sources of funding for wildlife conservation in Africa and South America for the years 2010 and 2020. Summarise the information by selecting and reporting the main features, and make comparisons where relevant.

Image for topic: The charts below show the main sources of funding for wildlife conservation in Africa and South America for the years 2010 and 2020. Summarise the information by selecting and reporting the main features, and make comparisons where relevant.
Our system will evaluate the answer based on this AI-generated description.
The image features two bar charts detailing wildlife conservation funding in millions of US dollars across four sources in 2010 and 2020, with x-axes labeled 'Funding Source' ('Government Grants', 'Private Donations', 'Corporate Sponsorships', 'Tourism Revenue') and y-axes labeled 'Funding (Millions of US Dollars)' with a legend for 2010 and 2020. The top chart, titled 'Wildlife Conservation Funding in Africa (2010 & 2020)' with y-axis ticks from 0 to 140 in increments of 20, lists values for 2010 and 2020 respectively as: Government Grants at 120 and 140; Private Donations at 80 and 110; Corporate Sponsorships at 40 and 50; and Tourism Revenue at 150 and 90. The bottom chart, titled 'Wildlife Conservation Funding in South America (2010 & 2020)' with y-axis ticks from 0 to 120 in increments of 20, lists values for 2010 and 2020 respectively as: Government Grants at 90 and 130; Private Donations at 60 and 80; Corporate Sponsorships at 70 and 90; and Tourism Revenue at 50 and 60.
Given the complexity of the image, the above description may not be entirely accurate.
Note: Both the topic and the answer were created by one of our users.

The tables give information about the source of funding for wildlife conservation in two continents (Africa and South America) in 2010 and 2020, measured in millions of US dollars.

Overall, the source for wildlife conservation in Africa mainly came from tourist revenue in 2010 and government grants in 2020. By contrast, wildlife conservation in South America has bigger funding in 2020 from all sources.

In Africa, tourist revenue has the biggest share in 2010 for its wildlife conservation, representing over 140 million before it declined to about 90 million in 2020. In 2020, the biggest funding source came from government grants, at exactly 140 million, while the smallest funding source in both years was corporate sponsorships, with 40 million in 2010 and roughly 50 million in 2020.

On the other hand, wildlife conservation funding in South America in 2010 and 2020 mainly came from government grants, accounting for around 90 million and over 120 million respectively. Conversely, the funding from tourism revenue was only 50 milliion in 2010 and 60 million in 2020, making it the smallest funding source in both years.

Word Count: 182

Answers On The Same Topic:

The charts below show the main sources of funding for wildlife conservation in Africa and South America for the years 2010 and 2020. Summarise the information by selecting and reporting the main features, and make comparisons where relevant.

The bar chart compares the major sources of funding for wildlife conservation in two regions, Africa and South America, between 2010 and 2020. Overall, it is clear that in Africa funding was primarily from tourism revenue, while in South America it was mainly from government grants, highlighting the difference between the two regions. When comparing […]

The charts below show the main sources of funding for wildlife conservation in Africa and South America for the years 2010 and 2020. Summarise the information by selecting and reporting the main features, and make comparisons where relevant.

The bar charts compares the major sources of funding for wildlife conservation in both countries such as Africa and South America in years between 2010 and 2020. Overall, it is clear that in Africa funding was highly used for tourism revenue, while in South America it was used for government grants which shows defference bbetween […]

The charts below show the main sources of funding for wildlife conservation in Africa and South America for the years 2010 and 2020. Summarise the information by selecting and reporting the main features, and make comparisons where relevant.

The barcharts display primary funding sources for wildlife conservation in Africa and South America in two different years, particularly, 2010 and 2020. Overall, the fundings from different sources have risen in the span of 10 years in both Africa and South America, with Tourism Revenue in Africa being an exception. In Africa, government grands in […]

The charts below show the main sources of funding for wildlife conservation in Africa and South America for the years 2010 and 2020. Summarise the information by selecting and reporting the main features, and make comparisons where relevant.

The given bar chart provides information about the expenditure spent for the conservation of wildlife in Africa and South America for the years 2010 and 2020. Overall, the funds provided by government grants remained the highest in both regions, while corporate sponsorship remained the lowest in Africa, and tourism revenue held the lowest position in […]

See All

Other Topics:

The charts below compare the number of bookings and the cost of staying for one night at large and small three-star, four-star and five-star hotels.

The bar charts compare the information about the number of bookings and cost of staying per night at small and large three-star, four-star and five-star hotels. It is clear that the number of bookings for large four-star hotels records by far the highest figure, whereas small five-star hotels account for the lowest bookings. Based on […]

The chart below shows the number of cars per 1,000 people in one country, and the average carbon dioxide emissions of a new car, in grams per kilometre, between 1990 and 2025. Summarise the information by selecting and reporting the main features, and make comparisons where relevant.

The given charts depict the information about the number of individual owned cars per 1000 individuals and approximate carbon dioxide it produce if it run one kilometre from the year 1990 to 2025. Overall, the number of cars per 1000 people rose over the given period, in contrast the carbon dioxide emission was reduced. 2025 […]

The chart below shows the number of cars per 1,000 people in one country, and the average carbon dioxide emissions of a new car, in grams per kilometre, between 1990 and 2025. Summarise the information by selecting and reporting the main features, and make comparisons where relevant.

The given charts depict the information about the number of individual owned cars per 1000 individuals and approximate carbon dioxide it produce if it run one kilometre from the year 1990 to 2025. Overall, the number of cars per 1000 people rose over the given period, in contrast the carbon dioxide emission was reduced. 2025 […]

You should spend about 20 minutes on this task. The two bar charts below show the proportion of 14-to 16-year-old students studying a foreign language in an English speaking country, and the top three foreign languages. Summarise the information by selecting and reporting the main features, and make comparisons where relevant. You should write at least 150 words.

The bar chart shows the proportion of 14 to 16 years old students studying a foreign language in English speaking country and the top of foreign languages. Overall,49 % of students who studied foriegn language involves girls in 1984.But,Boys includes 30 % who studied in English speaking country. It means girls learned foreign languages more […]

The pie charts below show the percentage of students at one adult education centre taking various courses offered in 1985 and this year. Summarise the information by selecting and reporting the main features, and make comparisons where relevant.

The pie chart compares the proportion of students, who take different courses on the one education centre in the 1985 and now. Overall, modern languages; which consist of French, German, and Spanish; was accounted as the course with the largest number of students in 1985, followed by fitness and dance, which have not had a […]

The charts below show information about the primary devices used by adults in the UK to access the internet, and the average weekly hours they spent online, for the years 2015 and 2020. Summarise the information by selecting and reporting the main features, and make comparisons where relevant.

The bar chart provide information about how primary devices are used by UK adults to access the internet and how many hours a week, in average, they spent online in 2015 and 2020 Overall, it’s clear that the smartphone became the most used device while the other three decreased the number of users. It’s also […]

See All
We have detected unusual activity on your device.
Please verify your identity to continue.
Note: This verification step won't sign you in. If you have a premium account, please log in to access the service as usual.
Google/Gmail Verification
Or verify using Email/Code
We've sent a verification code to:
youremail@gmail.com (Not your email?)
Enter it below to complete the verification process.
Ensure your email address is correct, your inbox is not full, and you check your spam folder. If no email arrives, consider using an alternative email.
You will need a Premium plan to perform your action!
Note: If you already have a premium account, please log in to access our services as usual.

Plans & Pricing

Our mission is to make quality education accessible for everyone.
However, to keep our hardworking team running and this service alive, we genuinely need your support!
By opting for a premium plan, not only do you sustain us in achieving the mission, but you also unlock advanced features to enrich your learning experience.

Free

For learners who aren't pressed for time

What's included on Free
100+ Cambridge IELTS Tests
Instant IELTS Writing Task 1 & 2 Evaluation (2 times/month)
Instant IELTS Speaking Part 1, 2, & 3 Evaluation (2 times/month)
Instant IELTS Writing Task 1 & 2 Essay Generator (2 times/month)
500+ Dictation & Shadowing Exercises
100+ Pronunciation Exercises
Flashcards
Other Advanced Tools

Premium

For those serious about advancing their English proficiency, and for IELTS candidates aspiring to boost their band score by 1-2 points (especially in writing & speaking) in just 30 days or less

What's included on Premium
Save Your IELTS Test Progress & Analyze Mistakes By Question Type
Save Your Own Flashcard Sets & Use Them On Any Device
Unlock All Courses, IELTS Tests, Section & Part Practice
Unlimited AI Conversations
Unlimited AI Writing Enhancement Exercises
Unlimited IELTS Writing Task 1 & 2 Evaluation
Unlimited IELTS Speaking Part 1, 2, & 3 Evaluation
Checked Answers Will Not Be Published
Unlimited IELTS Writing Task 1 & 2 Essay Generator
Unlimited IELTS Speaking Part 1, 2, & 3 Sample Generator
Unlimited Usage Of Advanced Tools & AI Features
Priority Support within 24h (12-month plan only)

Due to the nature of our service and the provided free trials, payments are non-refundable.