Our system will evaluate the answer based on this AI-generated description.
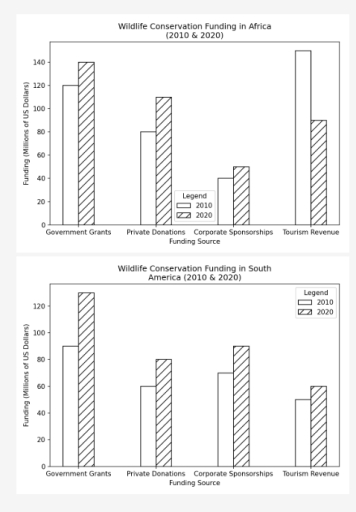
The image features two bar charts detailing wildlife conservation funding in millions of US dollars across four sources in 2010 and 2020, with x-axes labeled 'Funding Source' ('Government Grants', 'Private Donations', 'Corporate Sponsorships', 'Tourism Revenue') and y-axes labeled 'Funding (Millions of US Dollars)' with a legend for 2010 and 2020. The top chart, titled 'Wildlife Conservation Funding in Africa (2010 & 2020)' with y-axis ticks from 0 to 140 in increments of 20, lists values for 2010 and 2020 respectively as: Government Grants at 120 and 140; Private Donations at 80 and 110; Corporate Sponsorships at 40 and 50; and Tourism Revenue at 150 and 90. The bottom chart, titled 'Wildlife Conservation Funding in South America (2010 & 2020)' with y-axis ticks from 0 to 120 in increments of 20, lists values for 2010 and 2020 respectively as: Government Grants at 90 and 130; Private Donations at 60 and 80; Corporate Sponsorships at 70 and 90; and Tourism Revenue at 50 and 60.
Given the complexity of the image, the above description may not be entirely accurate.
Skyrocket your IELTS band score by 1-2 points in under a month with our premium plan!
Note: Both the topic and the answer were created by one of our users.
The barcharts display primary funding sources for wildlife conservation in Africa and South America in two different years, particularly, 2010 and 2020.
Overall, the fundings from different sources have risen in the span of 10 years in both Africa and South America, with Tourism Revenue in Africa being an exception.
In Africa, government grands in conserving wildlife have increased from 120 million USD to 140 million USD in 2020. Private donations have caused the funds to rise from around 80 million USD to around 120 million USD in the year 2020. Corporate sponsorships have contributed the least among the four mentioned sources, In 2010, the fundings were around 40 million USD. In 2020, this funding could not even reach 60 million USD. In case of South America, the fundings have increased over the years.
The largest source of fundings across South America and Africa remain government grants. However, fundings in tourism profit have decreased for Africa over 10 years, but have increased for South America.
Word Count: 165
