🔥 Today Only: Save 30% on Premium — Offer Ends Soon! - Upgrade Now!
Process Diagram

Band 8+: The diagram below shows the water cycle in both forested and urban areas. Summarise the information by selecting and reporting the main features and make comparisons where relevant.

Image for topic: The diagram below shows the water cycle in both forested and urban areas. Summarise the information by selecting and reporting the main features and make comparisons where relevant.
Our system will evaluate the answer based on this AI-generated description.
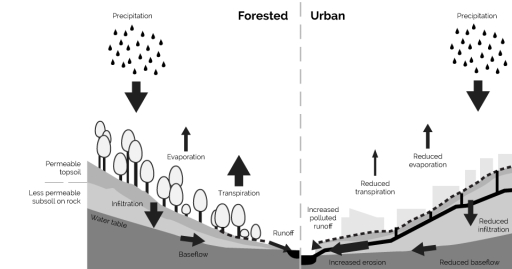
The image presents a comparative graphical depiction of water runoff in forested and urban settings. Both sections of the graph start with precipitation elements at the top. In the forested section, arrows point downward showing "Infiltration" through a "Permeable topsoil" and "Less permeable subsoil on rock" leading to "Water table" and then "Baseflow" with lateral arrows indicating "Evaporation" and "Transpiration" at the tree level, and "Runoff" at surface level. In contrast, the urban section arrows point towards "Reduced transpiration" and "Reduced evaporation" at the building level, with a significant arrow marked "Increased runoff" with side annotation "polluted" leading to "Increased erosion" with a consequential decrease in "Infiltration" and "Baseflow" compared to the forested section. There are no numerical data points or percentages provided.
Given the complexity of the image, the above description may not be entirely accurate.
Note: Both the topic and the answer were created by one of our users.

The diagram illustrates the cycle of water in areas with forests and cities.

Overall, the cycle starts and ends with the sky, beginning as precipitation such as rain or snow and ending with transpiration by plants or evaporation of water.

The cycle begins with precipitation, which reaches the permeable topsoil. The water then seeps through this layer and reaches the less waterproof subsoil layer which is situated on rocks. This process is known as infiltration. Notably, there is reduced infiltration in urbanised areas compared to the woods. The water then flows down the hill in a process called baseflow, which is also reduced in cities. Moreover, some water runs off the hill into a basin, with the water in the city considerably more polluted than the water in nature. Plants release the water through a process known as transpiration and some water is also evaporated from the soil. Interestingly, there are lower rates of transpiration and evaporation in the metropolis compared to the woodlands.

Word Count: 164

Answers On The Same Topic:

The diagram below shows the water cycle in both forested and urban areas. Summarise the information by selecting and reporting the main features and make comparisons where relevant.

The process diagram illustrtates the water cycle in two different reigons namely, forested and urban enviroments.The water cycle consists of four stages which are precipitation,trtanspiration,infiltration and runoff. Overall,the water cycle consists of four stages which are precipitation,trtanspiration,infiltration and runoff. The cycle of rainfalls start with infiltrtation and end with the evaporation and this is the […]

The diagram below shows the water cycle in both forested and urban areas. Summarise the information by selecting and reporting the main features and make comparisons where relevant.

The diagram compares the water cycle in forested and urban environments, highlighting the differences in water movement. Overall, the water cycle is a continuous process that repeats over time. In both environments, the process starts with precipitation (rainfall) and ends with runoff. In the forested area, rainwater infiltrates the permeable topsoil and moves downward through […]

The diagram below shows the water cycle in both forested and urban areas. Summarise the information by selecting and reporting the main features and make comparisons where relevant.

The water cycle plays a key role in maintaing a healthy ecosystem. Life would be impossible without rain! The diagrams showcase how various environmental factors both positively and negatively impact the rain cycle. The picture on the left demonstrates the process of precipitation in a rainforest. The presence of trees and permeable topsoil encourages plenty […]

The diagram below shows the water cycle in both forested and urban areas. Summarise the information by selecting and reporting the main features and make comparisons where relevant.

The diagram compares the water cycle processes in forested and urban areas. It highlights key differences in infiltration, runoff, and evaporation between the two environments. In forested regions, precipitation is largely absorbed by the permeable topsoil, allowing significant infiltration into the ground. This contributes to the formation of a stable water table and baseflow. Evaporation […]

The diagram below shows the water cycle in both forested and urban areas. Summarise the information by selecting and reporting the main features and make comparisons where relevant.

The diagram in question provides a insight view on water cycle forested and urban sides. overall, the the water cycle of both areas are same. As the picyure shows the water cycle has the same path in both areas, and it commences with the precipitation. as water fall to the permeable topsoil , and the […]

See All

Other Topics:

The diagrams below give information about two road tunnels in two Australian cities. Summarize the information by selecting and reporting the main features and make comparisons where relevant.

The presented diagrams show information about two different road tunnels in two Australian cities. Overall, the older tunnel is smaller in terms of depth and length compared to the one that was completed in 2006. In addition, the 2006 tunnel accommodates more traffic lanes with higher construction costs. Looking first at the tunnel built in […]

The diagram below illustrates the life cycle of a sunflower. Summarize the information by selecting and reporting the main features, and make comparisons where relevant.

The supplied diagram illustrates the natural process of the life cycle of a sunflower. Overall, it is a cyclical process providing information about several interconnected stages, commencing with planting seeds and eventually returning to the initial step of the process. The given graph also highlightes how a sunflower evolves naturally. To begin with, planted seeds […]

The diagram below shows the recycling process of aluminium drinks cans. Summarize the information by selecting and reporting the main features, and make comparisons where relevant.

The diagram illustrates the process by which aluminium drinks cans are recycled in 6 weeks. Overall, the whole process entails several stages, starting from transforming waste, followed by using chemicals and producing new cans for customers. Additionally, this process requires mainly machinery and minimal human intervention. In the initial phase of the whole process, the […]

WRITING TASK 1 You should spend about 20 minutes on this task. The graph shows how rain water is used for drinking water in Australia. Summarise the information by selecting and reporting the main features, and make comparison were relevant. Write at least 150 words.

The supplied graph provides information about how rain is transformed to drinking water. Overall, the diagram includes 7 main steps and the linear process commences with rain water falling on the roof of house and terminates with ready drink water. To begin with, rain water which is on the top of building is gone to […]

The diagram shows the stages of a dragonfly's life cycle.

The diagram delineates the data about the stages of dragonfly’s life cycle. Overall, it is immediatly apparent that there are 5 steps of its life cycle and there are 2 directions of the steps. Dragonfly’s earlier revolution starts under the water and in second phase it continues on the ground. Starting with the first phase […]

The table presents information about university-level academic staff in one country. Sunmarize the information

The diagram illustrates the organizational structure of a university’s academic staff system, showing the hierarchy and different staff categories. Overall, it is clear that the system follows a hierarchy, starting from the University Council at the top and then moving down to different types of staff. At the top of the structure is the University […]

See All
We have detected unusual activity on your device.
Please verify your identity to continue.
Note: This verification step won't sign you in. If you have a premium account, please log in to access the service as usual.
Google/Gmail Verification
Or verify using Email/Code
We've sent a verification code to:
youremail@gmail.com (Not your email?)
Enter it below to complete the verification process.
Ensure your email address is correct, your inbox is not full, and you check your spam folder. If no email arrives, consider using an alternative email.
You will need a Premium plan to perform your action!
Note: If you already have a premium account, please log in to access our services as usual.

Plans & Pricing

Our mission is to make quality education accessible for everyone.
However, to keep our hardworking team running and this service alive, we genuinely need your support!
By opting for a premium plan, not only do you sustain us in achieving the mission, but you also unlock advanced features to enrich your learning experience.

Free

For learners who aren't pressed for time

What's included on Free
100+ Cambridge IELTS Tests
Instant IELTS Writing Task 1 & 2 Evaluation (2 times/month)
Instant IELTS Speaking Part 1, 2, & 3 Evaluation (5 times/month)
Instant IELTS Writing Task 1 & 2 Essay Generator (2 times/month)
500+ Dictation & Shadowing Exercises
100+ Pronunciation Exercises
Flashcards
Other Advanced Tools

Premium

For those serious about advancing their English proficiency, and for IELTS candidates aspiring to boost their band score by 1-2 points (especially in writing & speaking) in just 30 days or less

What's included on Premium
Save Your IELTS Test Progress
Unlock All Courses & IELTS Tests
Unlimited AI Conversations
Unlimited AI Writing Enhancement Exercises
Unlimited IELTS Writing Task 1 & 2 Evaluation
Unlimited IELTS Speaking Part 1, 2, & 3 Evaluation
Checked Answers Will Not Be Published
Unlimited IELTS Writing Task 1 & 2 Essay Generator
Unlimited IELTS Speaking Part 1, 2, & 3 Sample Generator
Unlimited Usage Of Advanced Tools
Priority Support within 24h (12-month plan only)

Due to the nature of our service and the provided free trials, payments are non-refundable.
Nếu bạn là người Việt Nam và không có hoặc không muốn trả bằng credit/debit cards, bạn có thể thanh toán bằng phương thức chuyển khoản:


Chọn gói:
419,000₫ 277,000 ₫ cho gói 1 tháng (chỉ 9,233₫/ngày)
1,239,000₫ 597,000 ₫ cho gói 3 tháng (chỉ 6,633₫/ngày)
2,469,000₫ 1,027,000 ₫ cho gói 6 tháng (chỉ 5,706₫/ngày)
4,929,000₫ 1,417,000 ₫ cho gói 12 tháng (chỉ 3,936₫/ngày)


Sau khi chuyển khoản, vui lòng đợi trình duyệt tự động điều hướng bạn trở lại Engnovate và bạn sẽ ngay lập tức nhận được mã kích hoạt tài khoản premium.
Nếu có lỗi xảy ra, bạn có thể liên hệ với team thông qua một trong các phương thức: email đến helloengnovate@gmail.com hoặc nhắn tin qua facebook.com/engnovate.
Vì toàn bộ công cụ trên website đều có thể sử dụng thử miễn phí, Engnovate không hỗ trợ hoàn tiền.