🔥 Today Only: Save 30% on Premium — Offer Ends Soon! - Upgrade Now!
Process Diagram

Band 8+: The diagram below shows the water cycle in both forested and urban areas. Summarise the information by selecting and reporting the main features and make comparisons where relevant.

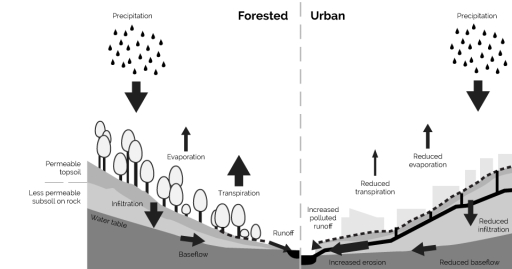
Image for topic: The diagram below shows the water cycle in both forested and urban areas. Summarise the information by selecting and reporting the main features and make comparisons where relevant.
Our system will evaluate the answer based on this AI-generated description.
The image presents a comparative graphical depiction of water runoff in forested and urban settings. Both sections of the graph start with precipitation elements at the top. In the forested section, arrows point downward showing "Infiltration" through a "Permeable topsoil" and "Less permeable subsoil on rock" leading to "Water table" and then "Baseflow" with lateral arrows indicating "Evaporation" and "Transpiration" at the tree level, and "Runoff" at surface level. In contrast, the urban section arrows point towards "Reduced transpiration" and "Reduced evaporation" at the building level, with a significant arrow marked "Increased runoff" with side annotation "polluted" leading to "Increased erosion" with a consequential decrease in "Infiltration" and "Baseflow" compared to the forested section. There are no numerical data points or percentages provided.
Given the complexity of the image, the above description may not be entirely accurate.
Note: Both the topic and the answer were created by one of our users.

The two diagrams illustrate the water cycle in a forest environment compared with a built-up human settlement.

In each diagram, there are six stages, starting with rainfall and culminating in runoff. Overall, the rainfall in the two areas remains the same, yet city areas show significantly less water re-entering the atmosphere and permeating the ground compared to areas of countryside.

Above ground, it can be seen that a greater proportion of the water evaporates from the ground and from the foliage in wooded areas than it does in cities. By contrast, proportionally more water goes over the surface in urban areas, becoming dirty or polluted as it flows through the settlement. While the level of erosion is not displayed in the forested area diagram, this phenomenon increases in cities.

Below the ground in forests, a significant amount of water soaks through the topsoil and subsoil, whereas less water infiltrates the subsoil in populated regions and this leads to a reduction in the baseflow. The water table is noticeably higher beneath forested areas than it is beneath cities.

Word Count: 177

Answers On The Same Topic:

The diagram below shows the water cycle in both forested and urban areas. Summarise the information by selecting and reporting the main features and make comparisons where relevant.

The process diagram illustrtates the water cycle in two different reigons namely, forested and urban enviroments.The water cycle consists of four stages which are precipitation,trtanspiration,infiltration and runoff. Overall,the water cycle consists of four stages which are precipitation,trtanspiration,infiltration and runoff. The cycle of rainfalls start with infiltrtation and end with the evaporation and this is the […]

The diagram below shows the water cycle in both forested and urban areas. Summarise the information by selecting and reporting the main features and make comparisons where relevant.

The diagram compares the water cycle in forested and urban environments, highlighting the differences in water movement. Overall, the water cycle is a continuous process that repeats over time. In both environments, the process starts with precipitation (rainfall) and ends with runoff. In the forested area, rainwater infiltrates the permeable topsoil and moves downward through […]

The diagram below shows the water cycle in both forested and urban areas. Summarise the information by selecting and reporting the main features and make comparisons where relevant.

The water cycle plays a key role in maintaing a healthy ecosystem. Life would be impossible without rain! The diagrams showcase how various environmental factors both positively and negatively impact the rain cycle. The picture on the left demonstrates the process of precipitation in a rainforest. The presence of trees and permeable topsoil encourages plenty […]

The diagram below shows the water cycle in both forested and urban areas. Summarise the information by selecting and reporting the main features and make comparisons where relevant.

The diagram compares the water cycle processes in forested and urban areas. It highlights key differences in infiltration, runoff, and evaporation between the two environments. In forested regions, precipitation is largely absorbed by the permeable topsoil, allowing significant infiltration into the ground. This contributes to the formation of a stable water table and baseflow. Evaporation […]

The diagram below shows the water cycle in both forested and urban areas. Summarise the information by selecting and reporting the main features and make comparisons where relevant.

The diagram in question provides a insight view on water cycle forested and urban sides. overall, the the water cycle of both areas are same. As the picyure shows the water cycle has the same path in both areas, and it commences with the precipitation. as water fall to the permeable topsoil , and the […]

See All

Other Topics:

Task 1 The diagrams below show the stages and equipment used in the cement-making process, and how cement is used to produce concrete for building purposes. Summarise the information by selecting and reporting the main features, and make comparisons where relevant. Write at least 150 words.

The diagram illustrates the process of manufacturing a cement and how it is used to produce a concrete. Overall, cement production involves multiple stages, beginning with the crushing and ending with packaging the cement. In contrast, concrete is much simpler to manufacture, requiring four fundamental products. Notably, the process is highly machine-driven, requiring a minimal […]

The diagram below shows how chipboard is created from wood and then used to make furniture. Provide an overview of the information by identifying and describing the key details, and include comparisons where appropriate.

The provided diagram delineates the processes of creating chipboard from wood and manufacturing furniture from this material. Overall, the process consists of 2 stages preparation and production. Iinitializing with logging of trees and ending with assembled furniture. Primarly, trees are cutted and trimmed to produce logs. Then the logs are sent into special facility that […]

Task 1: The diagrams below show the stages and equipment used in the cement- making process, and how cement is used to produce concrete for building purposes. Summarise the information by selecting and reporting the main features, and make comparison where relevant.

The diagrams illustrate the stages involved in producing cement from raw materials and the subsequent process of manufacturing concrete for construction purposes. Overall, cement production is a multi-stage industrial process that converts limestone and clay into bagged cement through crushing, mixing, heating and grinding. In contrast, concrete production is a simpler mixing process that combines […]

Task 1: The diagrams below show the stages and equipment used in the cement- making process, and how cement is used to produce concrete for building purposes. Summarise the information by selecting and reporting the main features, and make comparison where relevant.

The diagrams illustrate the stages involved in producing cement from raw materials and the subsequent process of manufacturing concrete for construction purposes. Overall, cement production is a multi-stage industrial process that converts limestone and clay into bagged cement through crushing, mixing, heating and grinding. In contrast, concrete production is a simpler mixing process that combines […]

The flow chart below shows how national examination papers are marked in Some land.

The flow chart illustrates how examination papers are marked nationally in some place. Overall , This chart demonstrates about listening , reading and writing . All these three exams go through a different process each for instance , reading and listening is collected after being checked by a administrator , whilst writing is first collected […]

The diagram below shows hơ the plastic bottles are recycled

The diagram illustrates the way plastic bottles are recycled. Overall, it is a cyclical process, which consist of 9 stages, beginning with collecting and ending with producing end products. The first step is that bottles are collected by people and the bottles are delivered to a recycling centre. Once the plastic bottles transformed to a […]

See All
We have detected unusual activity on your device.
Please verify your identity to continue.
Note: This verification step won't sign you in. If you have a premium account, please log in to access the service as usual.
Google/Gmail Verification
Or verify using Email/Code
We've sent a verification code to:
youremail@gmail.com (Not your email?)
Enter it below to complete the verification process.
Ensure your email address is correct, your inbox is not full, and you check your spam folder. If no email arrives, consider using an alternative email.
You will need a Premium plan to perform your action!
Note: If you already have a premium account, please log in to access our services as usual.

Plans & Pricing

Our mission is to make quality education accessible for everyone.
However, to keep our hardworking team running and this service alive, we genuinely need your support!
By opting for a premium plan, not only do you sustain us in achieving the mission, but you also unlock advanced features to enrich your learning experience.

Free

For learners who aren't pressed for time

What's included on Free
100+ Cambridge IELTS Tests
Instant IELTS Writing Task 1 & 2 Evaluation (2 times/month)
Instant IELTS Speaking Part 1, 2, & 3 Evaluation (2 times/month)
Instant IELTS Writing Task 1 & 2 Essay Generator (2 times/month)
500+ Dictation & Shadowing Exercises
100+ Pronunciation Exercises
Flashcards
Other Advanced Tools

Premium

For those serious about advancing their English proficiency, and for IELTS candidates aspiring to boost their band score by 1-2 points (especially in writing & speaking) in just 30 days or less

What's included on Premium
Save Your IELTS Test Progress & Analyze Mistakes By Question Type
Save Your Own Flashcard Sets & Use Them On Any Device
Unlock All Courses, IELTS Tests, Section & Part Practice
Unlimited AI Conversations
Unlimited AI Writing Enhancement Exercises
Unlimited IELTS Writing Task 1 & 2 Evaluation
Unlimited IELTS Speaking Part 1, 2, & 3 Evaluation
Checked Answers Will Not Be Published
Unlimited IELTS Writing Task 1 & 2 Essay Generator
Unlimited IELTS Speaking Part 1, 2, & 3 Sample Generator
Unlimited Usage Of Advanced Tools & AI Features
Priority Support within 24h (12-month plan only)

Due to the nature of our service and the provided free trials, payments are non-refundable.