🔥 Today Only: Save 30% on Premium — Offer Ends Soon! - Upgrade Now!
Map

Band 9: The diagrams below show the development of a small coastal village and its surrounding area into a tourist destination. Summarize the information by selecting and reporting the main features and make comparisons where relevant. Write at least 150 words.

Image for topic: The diagrams below show the development of a small coastal village and its surrounding area into a tourist destination. Summarize the information by selecting and reporting the main features and make comparisons where relevant. Write at least 150 words.
Our system will evaluate the answer based on this AI-generated description.
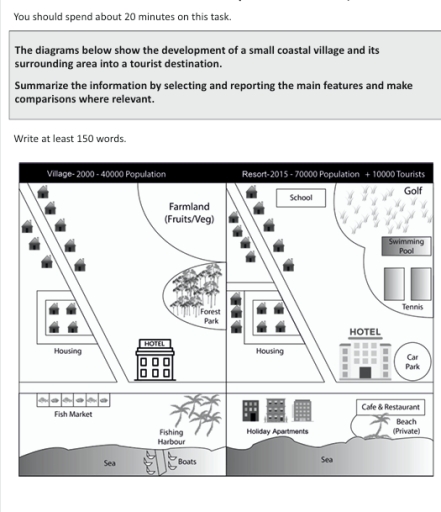
The image depicts two diagrams: the first is a village (2000) with 40,000 population and the second is a resort (2015) with 70,000 population and 10,000 tourists. In the village layout, there are two rows of housing along with farmland specified as fruits/vegetables, a centrally located forest park, and a hotel adjacent to one housing row. At the bottom, there is a fish market next to the fishing harbor with boats, situated along the sea. In contrast, the resort layout includes several changes: the previously existing housing areas now have expanded housing, a school near one housing row, and the hotel has expanded. Newly added facilities include a golf area, swimming pool, and tennis courts located near another housing row. The fish market has been replaced with holiday apartments, alongside a cafe and restaurant adjacent to a newly introduced private beach. A car park is introduced near the expanded hotel section, and the fishing harbor remains unchanged at the bottom along the sea.
Given the complexity of the image, the above description may not be entirely accurate.
Note: Both the topic and the answer were created by one of our users.

The diagrams illustrate the transformation of a coastal village in 2000 into a tourist resort by 2015. Overall, the area has evolved with significant changes in infrastructure, population, and a focus on tourism.

In 2000, the village had a population of 40000, and we can see housing, farmland for fruits and vegetables, a forest park, a hotel for outsiders, a fish market, and a fishing harbor with boats. At that time, it clearly focused on agriculture and fishing, with fewer facilities for tourism.

By 2015, the village had been developed into a resort, with an increase in population to over 70000, plus an additional 10000 tourists. Major transformations have occurred, including the replacement of farmland and the forest park with a golf course, tennis courts, and a swimming pool. Educational facilities, like schools, were added, and housing had expanded. A car park has been added near the hotel. The coastal area changed as the fish market and fishing harbor were replaced by holiday apartments, a private beach, a cafe, and a restaurant.

Word Count: 172

Answers On The Same Topic:

The diagrams below show the development of a small coastal village and its surrounding area into a tourist destination. Summarize the information by selecting and reporting the main features and make comparisons where relevant. Write at least 150 words.

The given map demonstrates about the accomplishment of a village to tourist destination with large number of emenities. In the peresent era the small coastal rural area is adapt into a place of enjoyment. To commence,After the development a huge change in population from 40000 to 70000 addition 10000 tourists. Furthermore, The farmland converted into […]

The diagrams below show the development of a small coastal village and its surrounding area into a tourist destination. Summarize the information by selecting and reporting the main features and make comparisons where relevant. Write at least 150 words.

The following diagram repressents the development of a small coastal area village into a tourist destination. Through out the years alot has changed. the village transformed into an amazing tourist destination, with huge improvements. In the year 2000 the population was pretty small and there wasn’t any tourists visiting. Which was expected because there wasn’t […]

The diagrams below show the development of a small coastal village and its surrounding area into a tourist destination. Summarize the information by selecting and reporting the main features and make comparisons where relevant. Write at least 150 words.

The diagrams illustrate about the transformation of a coastal village in 2000 into a tourist resort by 2015. Overall, the area has evolved with significant changes like infrastructure, population and mostly focued on tourism. In 2000, the village had a population of 40000 and we can see it has housing, farmland for fruits and vegetables, […]

See All

Other Topics:

The plans below show a village in the UK in 2000 and now. Summarise the information by selecting and reporting the main features and make comparison where relevant.

The map below illustrate two pictures of the same village in the UK, one of them is in the year 2000, while the other one is in the present time. Overall, the biggest diffrence is the amount of new constructions taking places, mainly houses and empty buildings. Map A,starting south going up north following the […]

The two maps show the layout of a university sports center in 2007 and its current layout.

The maps illustrate the changes of a university sports center in 2007 until now. Overall, there had been significant changes in infrastructure and facilities over the period, with the most noticeable changes being the relocation of the football pitch and the addition of running track. Meanwhile, the elimination of temporary teaching huts was removed, including […]

The layouts below show a city park before modifications and the same current park.

The given maps illustrate city park before and after transformation and let us investigate the differences between two versions. Overall, compared to the previous version, the modern park has much more infrastructure not only for leisure activity, that is nowadays presented on the left part of the park, but also for sport activity on the […]

Summarize the changes in the Layout of the Woodwards University in 1985 and now

The two maps illustrate information regarding modern and new facilities in Woodward university building area from 1985 to now. Overall, some buildings were expended and new and modern buildings were built, which resulted in the disappearance of many buildings. In addition, the green space appeared and it became eco-friendly. In 1985, there was an admin […]

The two maps show Kingston's University Hospital in 1990 and 2020.

The map illustrates huge developments that taken place in Kingston’s University Hospital over the period 1990-2020. Overall, a substantial change occured in the hospital’s area, particularly on the eastern side of the map compared to western side. In 2020, It can be seen that the north-east of the blueprint, the university hospital expanded into two […]

The diagrams below show the changes that took place in a coastal area called Pentland between 1950 and 2007. Provide an overview of the information by identifying and describing the key details, and include comparisons where appropriate.

The two maps illustrate the changes of Pentland took place in a coastal area over a 57-year period from 1950 to 2007 Overall, it is obvious that Pentland underwent a significant modernization, from a rural area dominated by grassland and industry into a coastal resort. Most noticeably, the expansion of resident areas and shopping facilities. […]

See All
We have detected unusual activity on your device.
Please verify your identity to continue.
Note: This verification step won't sign you in. If you have a premium account, please log in to access the service as usual.
Google/Gmail Verification
Or verify using Email/Code
We've sent a verification code to:
youremail@gmail.com (Not your email?)
Enter it below to complete the verification process.
Ensure your email address is correct, your inbox is not full, and you check your spam folder. If no email arrives, consider using an alternative email.
You will need a Premium plan to perform your action!
Note: If you already have a premium account, please log in to access our services as usual.

Plans & Pricing

Our mission is to make quality education accessible for everyone.
However, to keep our hardworking team running and this service alive, we genuinely need your support!
By opting for a premium plan, not only do you sustain us in achieving the mission, but you also unlock advanced features to enrich your learning experience.

Free

For learners who aren't pressed for time

What's included on Free
100+ Cambridge IELTS Tests
Instant IELTS Writing Task 1 & 2 Evaluation (2 times/month)
Instant IELTS Speaking Part 1, 2, & 3 Evaluation (2 times/month)
Instant IELTS Writing Task 1 & 2 Essay Generator (2 times/month)
500+ Dictation & Shadowing Exercises
100+ Pronunciation Exercises
Flashcards
Other Advanced Tools

Premium

For those serious about advancing their English proficiency, and for IELTS candidates aspiring to boost their band score by 1-2 points (especially in writing & speaking) in just 30 days or less

What's included on Premium
Save Your IELTS Test Progress & Analyze Mistakes By Question Type
Save Your Own Flashcard Sets & Use Them On Any Device
Unlock All Courses, IELTS Tests, Section & Part Practice
Unlimited AI Conversations
Unlimited AI Writing Enhancement Exercises
Unlimited IELTS Writing Task 1 & 2 Evaluation
Unlimited IELTS Speaking Part 1, 2, & 3 Evaluation
Checked Answers Will Not Be Published
Unlimited IELTS Writing Task 1 & 2 Essay Generator
Unlimited IELTS Speaking Part 1, 2, & 3 Sample Generator
Unlimited Usage Of Advanced Tools & AI Features
Priority Support within 24h (12-month plan only)

Due to the nature of our service and the provided free trials, payments are non-refundable.