Our system will evaluate the answer based on this AI-generated description.
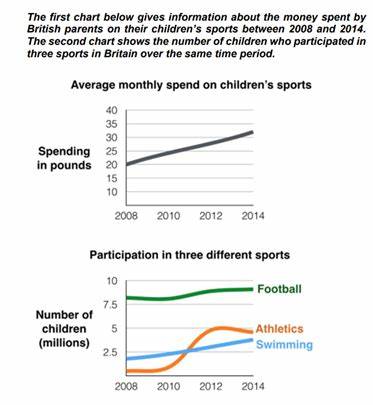
The image contains two charts displaying data from 2008 to 2014. The first chart, "Average monthly spend on children's sports," shows a steady increase in spending in pounds, starting at approximately 20 in 2008, rising to about 25 in 2010, around 30 in 2012, and reaching just over 35 in 2014. The second chart, "Participation in three different sports," illustrates the number of children in millions participating in Football, Athletics, and Swimming. Football participation starts at roughly 8.75 million in 2008, decreases slightly to approximately 8.5 million in 2010, then increases to just over 8.75 million in 2012, and maintains that level in 2014. Athletics begins at about 2.75 million in 2008, rises to nearly 5 million in 2010, then shows a slight decline to slightly under 5 million in 2012, and decreases to around 4 million in 2014. Swimming displays a constant participation of roughly 2.75 million from 2008 to 2014.
Given the complexity of the image, the above description may not be entirely accurate.
Skyrocket your IELTS band score by 1-2 points in under a month with our premium plan!
Note: Both the topic and the answer were created by one of our users.
The two-line graphs illustrate average monthly spend on three different sports – Football, Athletics, Swimming – in Britain over the years 2008-2014.
Overall, it is clear that the rate of spending money on sports witnessed a gradual growth during the whole period, and Football was the most dominant type of sport.
Turning to details, there was 20 pounds in the percentage of spending money on sports. However, this figure then rose significantly to around 33 pounds by the end of the span.
Regarding the other chart, we can see that the type of football was the most used type of sport among the other sports throughout the whole span. Increasing from approximately 8 million the number of football players then went up minimally to around 8.5 million in the final year. If we look at swimmers, there was also a slight growth in the figure for swimmers from just under 2.5 million to roughly 3.5 million over the span. By contrast, the athletic participants saw a fivefold rise at the end of the span.
Word Count: 174
