Our system will evaluate the answer based on this AI-generated description.
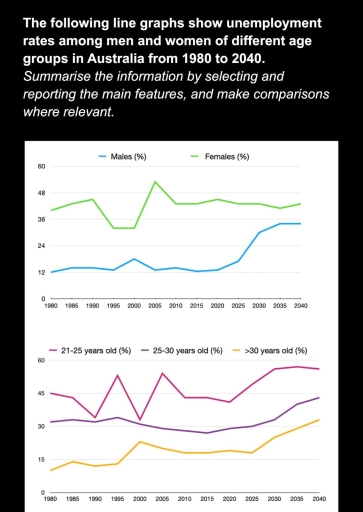
The image presents two line graphs detailing unemployment rates in Australia from 1980 to 2040, with data points listed as percentages. The first graph focuses on gender: Males - 1980: 12, 1985: 14, 1990: 15, 1995: 13, 2000: 18, 2005: 12, 2010: 14, 2015: 13, 2020: 13, 2025: 16, 2030: 30, 2035: 33, 2040: 34; Females - 1980: 39, 1985: 42, 1990: 47, 1995: 31, 2000: 31, 2005: 54, 2010: 43, 2015: 42, 2020: 43, 2025: 42, 2030: 42, 2035: 41, 2040: 42. The second graph is categorized by age group: 21-25 years old - 1980: 45, 1985: 43, 1990: 33, 1995: 54, 2000: 38, 2005: 56, 2010: 44, 2015: 43, 2020: 41, 2025: 49, 2030: 56, 2035: 57, 2040: 56; 25-30 years old - 1980: 31, 1985: 32, 1990: 33, 1995: 31, 2000: 30, 2005: 29, 2010: 29, 2015: 28, 2020: 28, 2025: 29, 2030: 33, 2035: 39, 2040: 44; >30 years old - 1980: 10, 1985: 14, 1990: 13, 1995: 13, 2000: 24, 2005: 21, 2010: 18, 2015: 17, 2020: 18, 2025: 16, 2030: 22, 2035: 28, 2040: 32.
Given the complexity of the image, the above description may not be entirely accurate.
Skyrocket your IELTS band score by 1-2 points in under a month with our premium plan!
Note: Both the topic and the answer were created by one of our users.
The two line graph compares unemployment rates between years 1980 and 2040 in Australia with details classification based on age category and gender.
Overall, The graph with gender classification shows that females are exceeding the number of unemployment of males. On the other hand, the age category graph seems to fluctuate rapidly at some period of time.
While the interval of unemployment rate between females and males are completely distanced, it explains that around year 2030 to 2040, males have a significant upward trend that nearly reach the females unemployment rate.
Turning to the graph based on age category, it summarise that fresh graduate and residents in their early twenties seems to have dramatic fluctuation mostly in three decade forward from 1965. As expected, the productive age of working (30+) initiate to have far less unemployment rate, in spite of that, the number increased by almost 50% in the year 2025 and seems to keep growing year by year.
Word Count: 159
