Our system will evaluate the answer based on this AI-generated description.
The image displays a bar chart depicting the frequency of eating at fast food restaurants among people in the USA from 2003 to 2013. For 2003, the percentage of people eating fast food every day was below 5%; several times a week was approximately 15%; once a week was just over 20%; once or twice a month was approximately 33%; a few times a year was just over 15%; and never was approximately 10%. For 2006, the percentage of people eating fast food every day was around 7%; several times a week was about 17%; once a week was approximately 25%; once or twice a month was just below 30%; a few times a year was about 15%; and never was just below 5%. For 2013, the percentage of people eating fast food every day was approximately 3%; several times a week was about 15%; once a week was just over 30%; once or twice a month was just below 30%; a few times a year was about 15%; and never was just over 5%.
Given the complexity of the image, the above description may not be entirely accurate.
Skyrocket your IELTS band score by 1-2 points in under a month with our premium plan!
Note: Both the topic and the answer were created by one of our users.
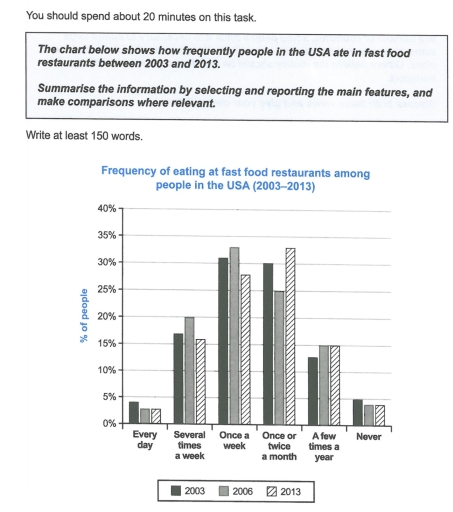
The provided bar chart illustrates how often people in the USA ate in fast food restaurant from 2003 to 2013.
Overall, most people ate in fast food in once a week and once or twice a month; every day and never these two categories had the lowest. Whereas, in 2006 was the once a week was the highest proportion of ate and people comparatively started eating more in 2013 in once or twice a month.
Upon examining the details, every day was slightly declined from 2003 to 2013 and never was few people ate fast food in 2003 to 2013. The severel times a week was fluctually increase and a few times a year was some raised from 2003 to 2013 in 13% to 15%.
On the other hand, the once a week was the highest in 2006 in 33% and it is more demandable fast food in USA. But, in 2003 and 2013 were the the percentage of 31% and 27%. In 2013, once or twice a month was the peak proportion was 33% in USA. Whereas, 2003 and 2006 was 30% and 25%.
Word Count: 185
