🔥 Today Only: Save 30% on Premium — Offer Ends Soon! - Upgrade Now!
Multiple Graphs

Band 6+: The graph and table below show the average monthly temperatures and the average number of hours of sunshine per year in three major cities Summarise the information by selecting and reporting the main features and make comparisons where relevant.

Image for topic: The graph and table below show the average monthly temperatures and the average number of hours of sunshine per year in three major cities Summarise the information by selecting and reporting the main features and make comparisons where relevant.
Our system will evaluate the answer based on this AI-generated description.
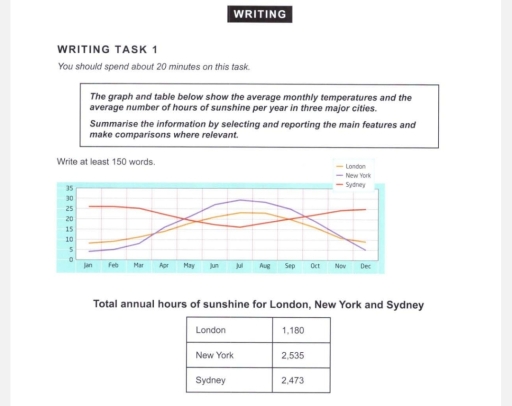
The image depicts a graph and a table; the graph illustrates average monthly temperatures over a year across three cities: London, New York, and Sydney, with temperatures in Celsius on the y-axis ranging from 0 to 30, matching months January to December on the x-axis; a line represents each city. Specific approximate monthly temperatures for London are: January 5°C, February 5°C, March 8°C, April 11°C, May 15°C, June 18°C, July 20°C, August 20°C, September 17°C, October 13°C, November 10°C, December 7°C. For New York: January 3°C, February 4°C, March 8°C, April 14°C, May 19°C, June 24°C, July 27°C, August 26°C, September 22°C, October 16°C, November 10°C, December 5°C. For Sydney: January 25°C, February 25°C, March 23°C, April 20°C, May 17°C, June 14°C, July 13°C, August 15°C, September 17°C, October 19°C, November 22°C, December 24°C. The table presents total annual hours of sunshine, with London at 1,180 hours, New York at 2,535 hours, and Sydney at 2,473 hours.
Given the complexity of the image, the above description may not be entirely accurate.
Note: Both the topic and the answer were created by one of our users.

The charts illustrate mean temperatures and the total number of hours of sunlight falling in three megapolises over a 12-month period.

Overall, while London and New York share similar weather patterns, becoming cold in December and January, Sydney remains mainly warm throughout the review period. However, interestingly, New York has the longest hours of sunshine among the cities.

To start with, in December, January, and February, the temperature in London and New York remains steady between 5 and 10 degrees, staying behind Sydney, with a difference of 15 degrees for this period. Beginning from May through to September, the weather becomes hotter in western cities compared to Sydney, with New York hitting a high of 30 degrees in July, which is higher for 10 units than in London. Meanwhile, Sydney has milder weather conditions, indicating 15 Celcius.

As for the hours of sunshine, New York and Sydney near to approximately 2500, being almost twice more than that of London, at 1180.

Word Count: 161

Answers On The Same Topic:

The graph and table below show the average monthly temperatures and the average number of hours of sunshine per year in three major cities Summarise the information by selecting and reporting the main features and make comparisons where relevant.

The line graph illustrates monthly temperature variations, while the table provides information on the total number of sunny hours in three cities (London, New York, and Sydney) throughout the year. Overall, New York and London show a practically similar trend, with the highest temperatures in summer and the lowest in winter. Conversely, Sydney had the […]

The graph and table below show the average monthly temperatures and the average number of hours of sunshine per year in three major cities Summarise the information by selecting and reporting the main features and make comparisons where relevant.

The given datas give information about average monthly temperatures and average number of hours of sunshine per year in London, New York, and Sydney. Overall, it is very clear that New York has the highest degress of temperature and total annual hours of sunshine. In addition, London has no significant changes of temperature and has […]

The graph and table below show the average monthly temperatures and the average number of hours of sunshine per year in three major cities Summarise the information by selecting and reporting the main features and make comparisons where relevant.

The diagram illustrates the average monthly temperatures across three major cities – Sydney, London, and New York – whereas the second graph demonstrates the mean sunshine hours in the same cities. Overall, Sydney is recorded with the highest monthly temperatures, while London and New York’s temperatures have experienced major fluctuations throughout the period. New York […]

The graph and table below show the average monthly temperatures and the average number of hours of sunshine per year in three major cities Summarise the information by selecting and reporting the main features and make comparisons where relevant.

The line graph illustrates the average monthly temperatures, while the table graph compares the popularity of different tupes of annual hours among sunshine in London, New- York, and Sydney. Overall, New York and London have similar temperature patterns, with hottest summer and coldest winter. The number of annual hours is highest in New York, followed […]

See All

Other Topics:

Global water use by sector and water consumption in two different countries

The given line graph illustrates changes in the consumption of water worldwide between 1900 and 2000, while the table compares population, irrigated land and per-capita water consumption in Brazil and the Democratic Republic of Congo in 2000. It is obvious that total worldwide water use increased significantly over the period, with agriculture consistently being the […]

WRITING TASK 1 You should spend about 20 minutes on this task. The two line graphs below show New Zealand import figures from Australia and Japan in the years 1994 - 2004. Summarise the information by selecting and reporting the main features, and make comparisons where relevant. You should write at least 150 words.

The two line graphs illustrate the value of imports to New Zealand from Japan and Australia between 1994 and 2004, measured in NZ$ million. Overall, imports from Australia demonstrated a consistent upward trend despite some fluctuations, whereas imports from Japan initially increased but experienced a pronounced decline after 2000. Throughout the period, Australia remained New […]

the chart and table below give information about online shopping by Australia and New Zealand customers in 2012

The images below provide data on online shopping by consumers from Australia and New Zealand in 2012. Overall, the vast majority of customers in both Australia and New Zealand prefer to combine local and international websites for shopping, and only a small percentage of individuals buy exclusively from foreign resources. The prime reason for buying […]

Chart A below shows the rate of oil consumption (in millions of barrels) in a small country from 1950 to 2010. Chart B shows the number of people employed in the oil industry in that country, and also the rate of unemployment throughout the country over the same time.

The two given charts illustrates the annual consuption millionbarrels and oil employee and the percentage of national unemployment from the year 1950 to 2010.Generally the annual consumption has shot up though it remained constant at the start of the certain year but has mantained the trend despite the number of employee and unemployed reducing over […]

The bar charts give information about the salaries and university fees of students from three universities in two spheres - Law and Business. Summarize information by selecting and reporting the main features and make comparisons where relevant

The charts demonstrate three different universities in two categories: Law and Business; in addition, it shows the amount of money paid by students to tuition fees and their monthly revenue. In detail, University A is the only university where students receive and pay the same amount of money in the sphere of Law ($40,000). Nevertheless, […]

The percentage of persons arrested in the five years ending 1994 and the most recent reasons for arrest.

The charts depict the percentage of people arrested and the reasons of being restrained from 1990 to 1994. Generally speaking, men were arrested much more frequently than women. Besides, the percentage of males committing various crimes was mostly higher as well. Starting with the ratio, there were 32% of men accused of being guilty, while […]

See All
We have detected unusual activity on your device.
Please verify your identity to continue.
Note: This verification step won't sign you in. If you have a premium account, please log in to access the service as usual.
Google/Gmail Verification
Or verify using Email/Code
We've sent a verification code to:
youremail@gmail.com (Not your email?)
Enter it below to complete the verification process.
Ensure your email address is correct, your inbox is not full, and you check your spam folder. If no email arrives, consider using an alternative email.
You will need a Premium plan to perform your action!
Note: If you already have a premium account, please log in to access our services as usual.

Plans & Pricing

Our mission is to make quality education accessible for everyone.
However, to keep our hardworking team running and this service alive, we genuinely need your support!
By opting for a premium plan, not only do you sustain us in achieving the mission, but you also unlock advanced features to enrich your learning experience.

Free

For learners who aren't pressed for time

What's included on Free
100+ Cambridge IELTS Tests
Instant IELTS Writing Task 1 & 2 Evaluation (2 times/month)
Instant IELTS Speaking Part 1, 2, & 3 Evaluation (2 times/month)
Instant IELTS Writing Task 1 & 2 Essay Generator (2 times/month)
500+ Dictation & Shadowing Exercises
100+ Pronunciation Exercises
Flashcards
Other Advanced Tools

Premium

For those serious about advancing their English proficiency, and for IELTS candidates aspiring to boost their band score by 1-2 points (especially in writing & speaking) in just 30 days or less

What's included on Premium
Save Your IELTS Test Progress & Analyze Mistakes By Question Type
Save Your Own Flashcard Sets & Use Them On Any Device
Unlock All Courses, IELTS Tests, Section & Part Practice
Unlimited AI Conversations
Unlimited AI Writing Enhancement Exercises
Unlimited IELTS Writing Task 1 & 2 Evaluation
Unlimited IELTS Speaking Part 1, 2, & 3 Evaluation
Checked Answers Will Not Be Published
Unlimited IELTS Writing Task 1 & 2 Essay Generator
Unlimited IELTS Speaking Part 1, 2, & 3 Sample Generator
Unlimited Usage Of Advanced Tools & AI Features
Priority Support within 24h (12-month plan only)

Due to the nature of our service and the provided free trials, payments are non-refundable.