Our system will evaluate the answer based on this AI-generated description.
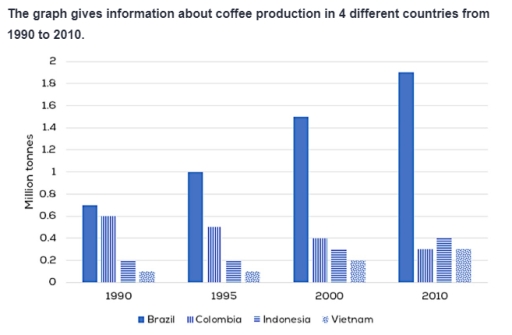
The image is a bar graph depicting coffee production in million tonnes for four countries - Brazil, Colombia, Indonesia, and Vietnam - over four time periods: 1990, 1995, 2000, and 2010. In 1990, Brazil produced 1.2 million tonnes, Colombia produced 0.6 million tonnes, Indonesia produced 0.2 million tonnes, and Vietnam produced 0.1 million tonnes. In 1995, Brazil increased to 1.4 million tonnes, Colombia decreased slightly to 0.5 million tonnes, Indonesia increased to 0.5 million tonnes, and Vietnam increased to 0.2 million tonnes. In 2000, Brazil decreased to 1.0 million tonnes, Colombia remained at 0.5 million tonnes, Indonesia increased to 0.6 million tonnes, and Vietnam saw a significant increase to 0.8 million tonnes. In 2010, Brazil jumped to 1.8 million tonnes, Colombia decreased to 0.4 million tonnes, Indonesia remained at 0.6 million tonnes, and Vietnam saw a substantial increase to 1.6 million tonnes. Brazil consistently had the highest production, while Vietnam saw the most dramatic increase from 1990 to 2010.
Given the complexity of the image, the above description may not be entirely accurate.
Skyrocket your IELTS band score by 1-2 points in under a month with our premium plan!
Note: Both the topic and the answer were created by one of our users.
The provided bar chart depicts the million tonnes of coffee production in four nations: Brazil, Colombia, Indonesia, and Vietnam. The information is given for the years 1990, 1995, 2000, and 2010.
Overall, it is clearly seen that the maximum million tonnes of coffee production from Brazil. However, it was followed by coffee production from Colombia.
Looking at the bar chart in detail, in 1990 the million tons of coffee production from Brazil was 0.7 million tones compared to 1 million tons in 1995. However, for the former year, the million tonnes of coffee production 0.6 million tone, 0.2 million tons, and 0.1 million tons from Colombia, Indonesia, and Vietnan. Wherever, for the latter year, the million tons of coffee production 0.5 million tons, and 0.2 million tons, and 0.1 million tons in same countries, respectively.
Analyzing the bar chart further, in 2000, coffee production from Brazil was at top position, at 1.5 million tons. However, it was follow
Word Count: 158
