Our system will evaluate the answer based on this AI-generated description.
The image is a bar graph depicting coffee production in million tonnes for four countries - Brazil, Colombia, Indonesia, and Vietnam - over four time periods: 1990, 1995, 2000, and 2010. In 1990, Brazil produced 1.2 million tonnes, Colombia produced 0.6 million tonnes, Indonesia produced 0.2 million tonnes, and Vietnam produced 0.1 million tonnes. In 1995, Brazil increased to 1.4 million tonnes, Colombia decreased slightly to 0.5 million tonnes, Indonesia increased to 0.5 million tonnes, and Vietnam increased to 0.2 million tonnes. In 2000, Brazil decreased to 1.0 million tonnes, Colombia remained at 0.5 million tonnes, Indonesia increased to 0.6 million tonnes, and Vietnam saw a significant increase to 0.8 million tonnes. In 2010, Brazil jumped to 1.8 million tonnes, Colombia decreased to 0.4 million tonnes, Indonesia remained at 0.6 million tonnes, and Vietnam saw a substantial increase to 1.6 million tonnes. Brazil consistently had the highest production, while Vietnam saw the most dramatic increase from 1990 to 2010.
Given the complexity of the image, the above description may not be entirely accurate.
Skyrocket your IELTS band score by 1-2 points in under a month with our premium plan!
Note: Both the topic and the answer were created by one of our users.
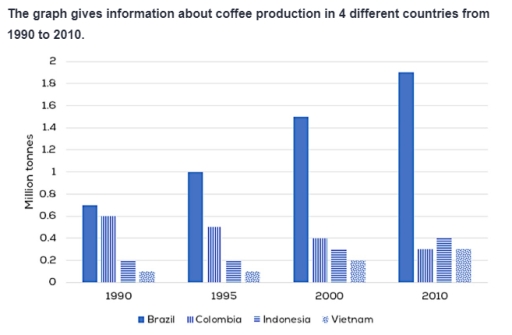
The bar chart shows how much coffe is produced in four different countries between 1990 and 2010, measured in million tonnes
Overall, Brazil was the highest coffee producing nation compared to other three countries: Indonesia, Columbia and Vietnam.
In 1990, Brazil stood at 0.7 million tonnes then reach 1 million tonnes in 1995. 5 years later, Brazil countinued to produced more coffee which was double the amount compared to its initial year. In addition, it kept growing its quota to approximately 1.9 million tonnes when the year 2010 came. Colombia also had a same beginning as Brazil. Instead of the country just maining its high yield, it went down the production to the point that was lower than Indonesia in 2010.
For Indonesia and Vietnam, 2 countries had the slowest increase rate in the period. In 1990, Indonesian coffee production was 0.2 million tonnes and Vietnamese counterpart was 0.1 million. They stayed the same in 1995 and began to rise in 2000. Indonesia had 0.4 million tonnes and Vietnam had 0.3 million tonnes as their final results in 2010.
Word Count: 179
