Our system will evaluate the answer based on this AI-generated description.
The image displays a line graph with four lines representing TOTAL, UK, OTHER, and ASIA over the years 1976, 1981, 1986, 1991, 1996, 2001, 2006, and 2011. The TOTAL line starts at approximately 5% in 1976, rises to about 10% by 1986, and continues to increase to approximately 11% in 1991, approximately 14% in 2001, and reaching around 22% by 2011. The UK line starts around 7% in 1976, drops to just under 5% by 1986, fluctuates up to around 9% by 1991, falls to about 6% in 2001, and then rises slightly to about 7% in 2011. The OTHER line starts from about 5% in 1976, rises to around 12% in 1986, peaks at around 17% in 1991, falls to about 14% in 1996, dropping further to about 9% in 2006 and rising slightly to around 11% in 2011. The ASIA line begins at around 2% in 1976, remains stable till 1981, then rises gradually to about 4% in 2006, and increases sharply to about 11% in 2011.
Given the complexity of the image, the above description may not be entirely accurate.
Skyrocket your IELTS band score by 1-2 points in under a month with our premium plan!
Note: Both the topic and the answer were created by one of our users.
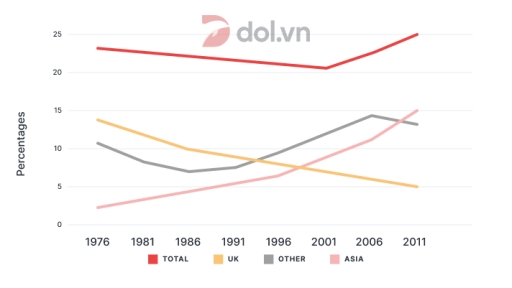
The horizontal line graph provides a breakdown of the proportion of Australians born in various countries of the world during the 35-year period from 1976 onwards.
At first glance, the number of people born in Asia and other countries has a similar pattern; however, that in UK followed the reverse trend during the given time frame.
To be specific, both the people borning in Asia and others followed an upward trend. In the first 10 years, the people of other cities was declined and hit a low at under 10% in 1986, after that, it significantly grown up until 2006. In the 5 years, the people born in other cities remained, and finishing at below 15% in 2011. Meanwhile, the number of people born in Asia just dramatically changed throughout 35 years, initiating at under 5% before reaching exactly 15% in 2011.
When it comes to UK, it is evident that it follow a downward trend. The figure started at approximately 15% in 1976, falling deeply throughout the period after that, then finishing at 5% in 2011.
Following the trend of the number in each areas, the total also fluctuated sharply when went down from 1976 to 1986 and rocketed quickly in the last 25-year period.
Word Count: 206
