Our system will evaluate the answer based on this AI-generated description.
The image is a line graph titled "Oil use of major consumers" with the x-axis representing years (2009, 2015, 2025, 2030) and the y-axis representing millions of barrels per day, ranging from 0 to 10 in increments of 2. Four lines depict the oil use of different consumers: US (dotted line), China (solid line with triangles), Western Europe and Japan (solid line), Middle East (dashed line with circles). In 2009, US used around 9 million barrels per day, Western Europe and Japan about 5, China approximately 3.5, and Middle East nearly 2. By 2015, US declined to around 8, Western Europe and Japan to 4, Middle East increased to 3, and China rose to about 6. The projected use in 2025 shows US at 6, Western Europe and Japan at 3, China at 8, and Middle East at 4. By 2030, US is expected to decrease to 5.5, Western Europe and Japan to 2.5, China to maintain at 8, and Middle East to increase to 5.
Given the complexity of the image, the above description may not be entirely accurate.
Skyrocket your IELTS band score by 1-2 points in under a month with our premium plan!
Note: Both the topic and the answer were created by one of our users.
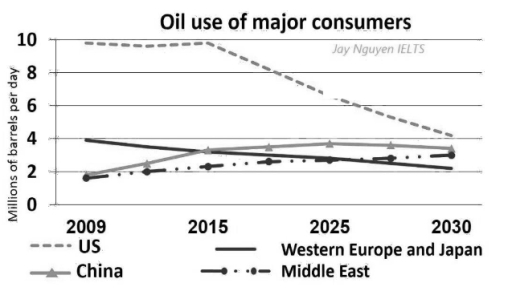
The line graph compares total oil consumption in the US, China, Western Europe and Japan, and the Middle East between 2009 and 2030, measured in millions of barrels per day.
Overall, the US remains by far the largest consumer throughout, but its oil use falls sharply after 2015. By contrast, China and the Middle East show steady growth, with China becoming the second-largest user from 2015 onward. Meanwhile, Western Europe and Japan record a continual decline and end the period as the smallest consumer.
In 2009, the US used just under 10 million barrels per day, roughly two and a half times as much as Western Europe and Japan (about 4). American consumption stayed close to 10 until 2015, then dropped markedly to around 6.5-7 by 2025 and fell further to approximately 4 by 2030.
China followed the opposite pattern, rising from about 2 million barrels per day in 2009 to just over 3 in 2015, peaking at roughly 3.8 in 2025 before edging down slightly to around 3.5 in 2030. The Middle East increased more gradually, from about 1.6 to around 3 by 2030. In contrast, Western Europe and Japan declined steadily from 4 to just above 2 over the period.
Word Count: 202