Our system will evaluate the answer based on this AI-generated description.
The image shows a line graph titled "U.S. Energy Consumption by Fuel (1980-2030)" with data from 1980 to 2007 as history and projected data from 2010 to 2030. The graph displays energy consumption in quadrillion units on the y-axis and time in years on the x-axis. Petrol and Oil consumption starts at approximately 35 quadrillion units in 1980, reaching nearly 45 quadrillion units in 2007 and projected to reach over 50 quadrillion units by 2030. Coal consumption begins at just over 15 quadrillion units, increasing to almost 25 quadrillion units in 2007 and projected at 30 quadrillion units in 2030. Natural Gas consumption starts at around 15 quadrillion units, with a steady increase to 25 quadrillion units in 2007 and projected to continue to about 30 quadrillion units in 2030. Nuclear, Solar/Wind, and Hydropower have significantly lower consumption levels, all starting below 5 quadrillion units in 1980. Nuclear energy shows a gradual increase to approximately 8 quadrillion units by 2007, with a projection of nearly 10 quadrillion units by 2030. Solar/Wind energy sees the most significant projected increase, starting at nearly 0 quadrillion units in 1980, with a slight increase to almost 3 quadrillion units in 2007 and an anticipated surge to 10 quadrillion units by 2030. Hydropower consumption remains relatively stable, starting at just over 2 quadrillion units, with little change by 2007 and a small projected increase to about 4 quadrillion units by 2030.
Given the complexity of the image, the above description may not be entirely accurate.
Skyrocket your IELTS band score by 1-2 points in under a month with our premium plan!
Note: Both the topic and the answer were created by one of our users.
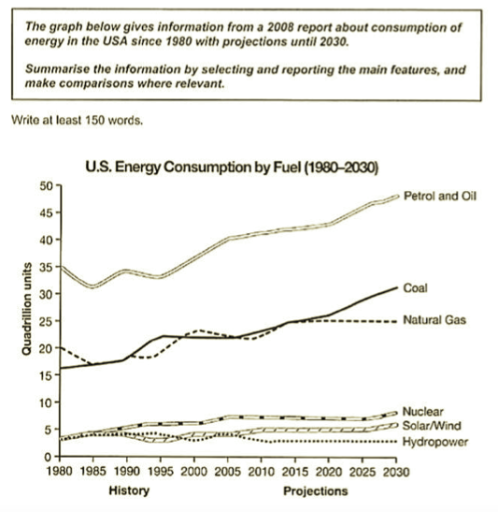
The graph shows the consumption of energy in USA years between 1980 to 2008, with the forecast until 2030.
Overall, the consumption of petrol and oil were at the peak, the coal and natural gas were trying climb one another. The rest of the energies had a unstable growth.
Firstly, the petrol and oil had a major fall and climbed constantly over the period of 2008, reached 40 quadrillion units were used. Even the prediction move in postive direction, in 2030 it will be recorded 50 quadrillion unit. While other energy has attained more than a half of the petrol and oil. Natural gas began with a 20 quadrillion, fall apperently to 16. it was unstable till the period of 2011, In 2008 it was in downfall. Then the prediction shows it will move high and stay consistant till the year of 2030. Whereas, the coal postive growth over the period till 1995, then it commence to fall. Around the year 2008. In the forecast it begin to rise again reached 30 in period of 2030.
Futhermore, the nuclear commenced on 4 quadrillion and had a slight growth from the year 1980 to 2008 and the prediction energy were stable move till the year of 2030 and reached 7 quadrillion. Then the solar/ wind started with 4 quadrillion and had a slight difficulty in intial period of 1995, Later it got travel in postive manner till 2030. The hydropower had a unfortunate hike and fall till the year of 2010. then it turned to stable but considered a least on overall consumption throughtout the year of 2030.
Word Count: 267
