Our system will evaluate the answer based on this AI-generated description.
The image displays a line graph charting employment patterns in the USA by sector from 1930 to 2010. The X-axis ranges from 1930 to 2010 in ten-year increments, and the Y-axis displays percentages from 0 to 75 in increments of 25. The 'Industrial' sector shows a steep decline from approximately 55% in 1930 to about 10% in 2010. 'Technical' jobs exhibit a gradual rise from near 5% to just over 25%. The 'Sales and Office' sector starts around 10%, peaks near the 50% mark around 2000, then slightly declines to just below 50% in 2010. 'Other Services' sector remains below 25%, rising long-term from about 5% to 15%. 'Farming, fishing and Forestry' sector displays a gradual decline, starting above 15% and stateside falling near 5%. The intersect points include 'Technical' crossing 'Farming, Fishing and Forestry' near 1960 at around 15%, 'Sales and Office' surpassing 'Industrial' near 1940 just under 25%, and 'Technical' intersecting 'Other Services' near 2000 at about 15%.
Given the complexity of the image, the above description may not be entirely accurate.
Skyrocket your IELTS band score by 1-2 points in under a month with our premium plan!
Note: Both the topic and the answer were created by one of our users.
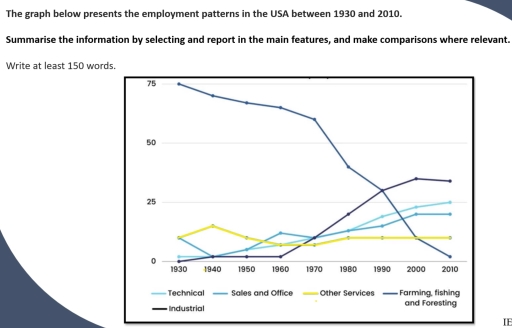
The line graph illustrates the hiring trends of the United States from 1930 to 2010.
Overall, The Farming, fishing, and foresting employment rate is at its peaked at the start but it had decline greatly at the end. It is seen to be the opposite results in the industrial area.
In 1930, the agricultural sector was at its highest rate at the proportion of 75% in the graph. But over the time it has a gradual downtrend and significantly decreased to be lowest out of all five sectors at nearly less than 5% in 2010. Whereas, the industrial hiring trend started at 0% in 1930, then it had a slight rise in the number of employees followed by a constant rate up until after 1960 it began to surged up the chart, being the number one sector in the end. The technical area has been slowly going up reaching 25%. In the sales and office department there has been fluctuations in the trends but in the end it is still the in the third rank after industrial and technical sectors. Other services, overall has stayed at a constant rate even though it had some ups and down.
Word Count: 197