Our system will evaluate the answer based on this AI-generated description.
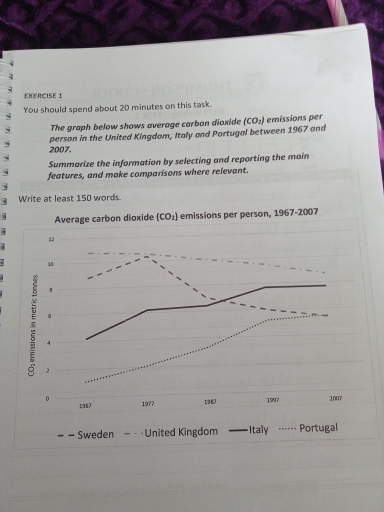
The image depicts average carbon dioxide (CO2) emissions per person for four countries between 1967 and 2007. In 1967, Sweden and United Kingdom were both near 11 metric tonnes, Italy was at 4 metric tonnes, and Portugal was near 1 metric tonne. By 1977, Sweden peaked close to 12 metric tonnes, the United Kingdom remained near 11 metric tonnes, Italy rose to around 6 metric tonnes, and Portugal increased to approximately 2.5 metric tonnes. In 1987, Sweden's emissions declined to 8 metric tonnes, the United Kingdom's slightly decreased to 10 metric tonnes, Italy was at about 7 metric tonnes, and Portugal approached 4 metric tonnes. For 1997, Sweden's emissions increased slightly to around 9 metric tonnes, the United Kingdom's emissions remained constant around 9 metric tonnes, Italy's rose to 8 metric tonnes, and Portugal's emissions steadied at about 5 metric tonnes. By 2007, Sweden’s emissions dropped to 6 metric tonnes, the United Kingdom’s declined to 9 metric tonnes, Italy’s stabilized at 8 metric tonnes, and Portugal’s emissions climbed to around 5 metric tonnes.
Given the complexity of the image, the above description may not be entirely accurate.
Skyrocket your IELTS band score by 1-2 points in under a month with our premium plan!
Note: Both the topic and the answer were created by one of our users.
The chart illustrates the comparison of average carbon dioxide consumption per person in four countries, which is the United Kingdom, Sweden, Italy, and Portugal from 1967 to 2007. Overall, the emissions of CO2 per person in Italy and Portugal has increased. However, the the United Kingdom and Sweden lead for the emissions of CO2 only at the beginning, instead of keep leading, the emissions decreased in the end.
The emissions of CO2 in Italy and Portugal have grown significantly even though they are the lowest in the beginning. Portugal in 1967 only had 1 metric ton of consumption in the beginning and they slowly rose until 5 metric ton in 2007 and its close level with Sweden. Unlike Portugal, Italy starts with the second last but Italy has the same with Portugal for the emissions of CO2. Italy start with 4 metric ton of consumption CO2 and than they had increased significant until 1987 Italy unperform Sweden their stop in 2007 with take second place as big consumption of CO2.
Meanwhile, United Kingdom and Sweden are top levels of CO2 consumption in the beginning but they slowly dropped until the end of 2007. United kingdom started with 11 metric ton of consumption CO2 and slowly dropped until 9 metric ton in the end. However, Sweeden start with 8 metric ton of consumption CO2 and slowly dropped until 5 metric ton the end and become the third place of consumption CO2.
Word Count: 240
