🔥 Today Only: Save 30% on Premium — Offer Ends Soon! - Upgrade Now!
Line Graph

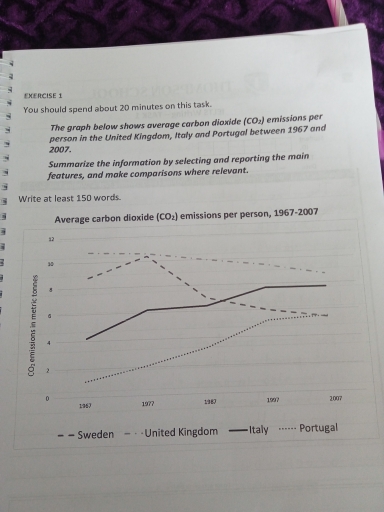
Band 4+: The graph below shows average carbon dioxide (CO2) emissions per person in the Uk, sweden, portugal and italy

Image for topic: The graph below shows average carbon dioxide (CO2) emissions per person in the Uk, sweden, portugal and italy
Our system will evaluate the answer based on this AI-generated description.
The image depicts average carbon dioxide (CO2) emissions per person for four countries between 1967 and 2007. In 1967, Sweden and United Kingdom were both near 11 metric tonnes, Italy was at 4 metric tonnes, and Portugal was near 1 metric tonne. By 1977, Sweden peaked close to 12 metric tonnes, the United Kingdom remained near 11 metric tonnes, Italy rose to around 6 metric tonnes, and Portugal increased to approximately 2.5 metric tonnes. In 1987, Sweden's emissions declined to 8 metric tonnes, the United Kingdom's slightly decreased to 10 metric tonnes, Italy was at about 7 metric tonnes, and Portugal approached 4 metric tonnes. For 1997, Sweden's emissions increased slightly to around 9 metric tonnes, the United Kingdom's emissions remained constant around 9 metric tonnes, Italy's rose to 8 metric tonnes, and Portugal's emissions steadied at about 5 metric tonnes. By 2007, Sweden’s emissions dropped to 6 metric tonnes, the United Kingdom’s declined to 9 metric tonnes, Italy’s stabilized at 8 metric tonnes, and Portugal’s emissions climbed to around 5 metric tonnes.
Given the complexity of the image, the above description may not be entirely accurate.
Note: Both the topic and the answer were created by one of our users.

The line graph illustrate the standard release of corbon dioxide per head between 1967 to 2007 in five european countries.

overall it is clear that the production of corbon dioxidein potugal and Italy was increased throughout the period equally,while in united kingdom per individual exhalation was significantly highest from the start of the term .

the production of gas in united kingdom was significantly highest at 1967 as compare to othe three countries which was gradually declined at 9 metric ton in 2007 but still at highest point,while the release of co2in sweden was 8.5 tonne in the begining then rapidly jump to follow year at10.4 tonnes which is declined at 4.9 tonnes in 2007 .

howeverin contarastth emission of corbon dioxide in Italy was at 4.1tonnes in beginning and portugal was at 1.7tonnes then thay both steadily increased and emission of gas in Italy in 2007 was achieved at 7.9 tonnes and portugal completed at 5.8 tonnes

Word Count: 158

Answers On The Same Topic:

The graph below shows average carbon dioxide (CO2) emissions per person in the Uk, sweden, portugal and italy

The line graph illustrates the average carbon dioxide (CO2), emissions per person in the United Kingdom, Sweden, Italy and Portugal Between 1967 and 2007, measured in tonnes. Overall, the four countries followed different trends over the period. Italy and Portugal experienced increase significantly, while the United Kingdom and Sweden experienced decrease gradually. The United Kingdom […]

The graph below shows average carbon dioxide (CO2) emissions per person in the Uk, sweden, portugal and italy

The line graph illustrates the mean of carbon dioxide emissions per person in four different european countries in the period of 40 years. Overall, United Kingdom and Sweden were two countries that significantly reduced their carbon dioxide emissions in the period given. Conversly, Italy and Portugal augmented their CO2 emissions per person. Looking at the […]

The graph below shows average carbon dioxide (CO2) emissions per person in the Uk, sweden, portugal and italy

The line graph illustrates the amount of carbon dioxide emitted per person in four countries including the UK, Sweden, Italy and Portugal from 1967 to 2007. It is clear that the amount of carbon dioxide emitted to the Italy and Portugal increased, during the period from 1967 to 2007. In contrast, the UK and Sweden […]

The graph below shows average carbon dioxide (CO2) emissions per person in the Uk, sweden, portugal and italy

The presented chart shows carbon dioxide emissions per capita in the UK, Sweden, Italy, and Portugal, measured in metric tons. The graph shows data for the period between 1967 and 2007. Overall, emission figures for Northern European countries were on the decline, while the corresponding numbers for Southern European countries were rising. Looking at the […]

See All

Other Topics:

The graph shows population variation in three wildlife species from 2011 to 2016. Summarize the information by selecting and reporting main features and make comparisons where relevant.

The line graph illustrates population variation in three North America wild animals from 2011 to 2016. Overall, while the number of bears experienced an upward trend, there was a significant decrease in dolphin populations. Additionally, the number of whales witnessed the most dramatic fluctuation. In 2011, Dolphin population was the highest, standing at 160 million […]

The chart below shows the changes in ownership of electrical appliances. Summarise the information by selecting and reporting the main features, and make comparisons where relevant.

The provided line graphs illustrate the proportion of households with electrical appliances and the duration of housework per week from 1920 to 2019. Overall, percentages of households with refrigerators and vacuum cleaners showed an upward trend, whereas the number of hours of housework per week experienced a steady decrease throughout the period. In 1920, the […]

The line graph shows figures for unemployment in the UK workforce between May 2003 and July 2006.

The graph shows that amount of unemployment between the people whose age is older then 16 in the years from 2003 to 2006. We can say that the start of the may 2003 the unemployment was between 5% and 5.2%. At the starting of the graph we can see the increase until september. Then it […]

The line graph shows the percentage of tourists to Scotland who visited four different attractions from 1980 to 2010. Summarise the information by selecting and reporting the main features, and make comparisons where relevant.

The line graph depicts the quantitative measure of tourists visited on four various destinations in Scotland between 1980 and 2010. Significantly, the aquarium had its maximum visitors in the year of 1985, which apparently faced a contineous decline from 1995 to 2010. The least count has been recorded in the year of 2010 with the […]

The graph below shows radio and television audiences throughout the day in1992.

The graph illustrates changes in percentage of the audience who listened to the radio and watched the television during the day in 1992. Overall, television was more popular in the second half of the day, while radio attracted more listeners in the first half. Both of TV and radio started changing after 6.00. Regarding the […]

See All
We have detected unusual activity on your device.
Please verify your identity to continue.
Note: This verification step won't sign you in. If you have a premium account, please log in to access the service as usual.
Google/Gmail Verification
Or verify using Email/Code
We've sent a verification code to:
youremail@gmail.com (Not your email?)
Enter it below to complete the verification process.
Ensure your email address is correct, your inbox is not full, and you check your spam folder. If no email arrives, consider using an alternative email.
You will need a Premium plan to perform your action!
Note: If you already have a premium account, please log in to access our services as usual.

Plans & Pricing

Our mission is to make quality education accessible for everyone.
However, to keep our hardworking team running and this service alive, we genuinely need your support!
By opting for a premium plan, not only do you sustain us in achieving the mission, but you also unlock advanced features to enrich your learning experience.

Free

For learners who aren't pressed for time

What's included on Free
100+ Cambridge IELTS Tests
Instant IELTS Writing Task 1 & 2 Evaluation (2 times/month)
Instant IELTS Speaking Part 1, 2, & 3 Evaluation (2 times/month)
Instant IELTS Writing Task 1 & 2 Essay Generator (2 times/month)
500+ Dictation & Shadowing Exercises
100+ Pronunciation Exercises
Flashcards
Other Advanced Tools

Premium

For those serious about advancing their English proficiency, and for IELTS candidates aspiring to boost their band score by 1-2 points (especially in writing & speaking) in just 30 days or less

What's included on Premium
Save Your IELTS Test Progress & Analyze Mistakes By Question Type
Save Your Own Flashcard Sets & Use Them On Any Device
Unlock All Courses, IELTS Tests, Section & Part Practice
Unlimited AI Conversations
Unlimited AI Writing Enhancement Exercises
Unlimited IELTS Writing Task 1 & 2 Evaluation
Unlimited IELTS Speaking Part 1, 2, & 3 Evaluation
Checked Answers Will Not Be Published
Unlimited IELTS Writing Task 1 & 2 Essay Generator
Unlimited IELTS Speaking Part 1, 2, & 3 Sample Generator
Unlimited Usage Of Advanced Tools & AI Features
Priority Support within 24h (12-month plan only)

Due to the nature of our service and the provided free trials, payments are non-refundable.