Our system will evaluate the answer based on this AI-generated description.
The image displays a line graph titled "Average annual expenditure on cell phone, national and international fixed-line services, 2001-2010." Three lines represent different services: cell phone services (dashed line), international fixed-line services (solid line), and national fixed-line services (dotted line). The x-axis represents years from 2001 to 2010, and the y-axis shows expenditure in dollars, ranging from $100 to $800. The cell phone services line shows an upward trend starting at approximately $200 in 2001 and reaching $700 in 2010. The international fixed-line services line shows a downward trend starting at approximately $700 in 2001 and falling to $400 in 2010. The national fixed-line services line remains relatively stable, starting at around $300 in 2001, increasing slightly to $400 in the middle years, and ending around $300 in 2010.
Given the complexity of the image, the above description may not be entirely accurate.
Skyrocket your IELTS band score by 1-2 points in under a month with our premium plan!
Note: Both the topic and the answer were created by one of our users.
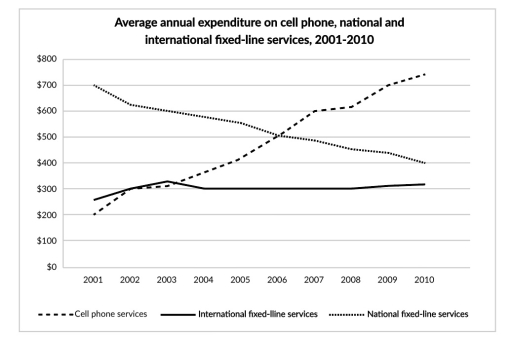
The line graph depicts moderate US clients’ spending on mobile phone and residential phone services over a period of 9 years, from 2001 to 2010.
In general, the data reveals that the use of residential landline phones was higher in the earlier years, but gradually became the least popular choice, while mobile phone usage was initially low but increased significantly, ultimately surpassing landline services.
Notably, mobile phone users spent $200 in 2001. After some fluctuations, this amount rose to $300 by 2003, and then saw a sharp increase, reaching $600 in 2007. Following this surge, the expenditure continued to grow steadily, reaching $750 per year by 2010.
On the other hand, landline services cost just under $700 in 2001, but experienced a decline, dropping to $500 by 2006, when the two services crossed over. The expenditure on residential phone services continued to decrease, falling to $400 in 2010, the lowest in the ten-year period.
Word Count: 154