Our system will evaluate the answer based on this AI-generated description.
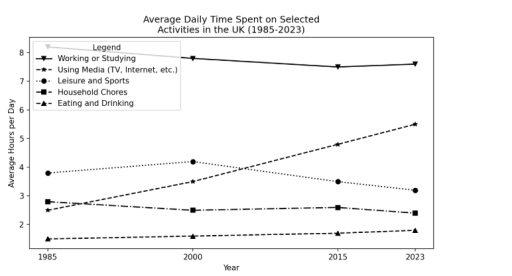
The image features a line graph titled "Average Daily Time Spent on Selected Activities in the UK (1985-2023)", plotting "Average Hours per Day" (y-axis, values 2 to 8) against "Year" (x-axis, years 1985, 2000, 2015, 2023) across five categories defined in the Legend. Working or Studying values are approximately 8.2 hours in 1985, 7.8 hours in 2000, 7.5 hours in 2015, and 7.6 hours in 2023. Using Media (TV, Internet, etc.) values are approximately 2.5 hours in 1985, 3.5 hours in 2000, 4.8 hours in 2015, and 5.5 hours in 2023. Leisure and Sports values are approximately 3.8 hours in 1985, 4.2 hours in 2000, 3.5 hours in 2015, and 3.2 hours in 2023. Household Chores values are approximately 2.8 hours in 1985, 2.5 hours in 2000, 2.6 hours in 2015, and 2.4 hours in 2023. Eating and Drinking values are approximately 1.5 hours in 1985, 1.6 hours in 2000, 1.7 hours in 2015, and 1.8 hours in 2023.
Given the complexity of the image, the above description may not be entirely accurate.
Skyrocket your IELTS band score by 1-2 points in under a month with our premium plan!
Note: Both the topic and the answer were created by one of our users.
The presented graph represents the average daily hours spent in the UK for five different activities over a period of 28 years from 1985 to 2023.
Overall, what stands out from the graph is that working or studing is the most popular in 1985, unlike eating and drinking which is the lowest activity. However, the use of media increased dramatically over the period in question.
Upon taken a deeper look, we will find that using social media increased from 2.5 hours at the beginning of the period to 5.5 by the end of the period. The time spent in leisure and sports is also increased to just above 4 hours in 2000; however, it fall over dramatically to about 3.2 hours in 2023.
Regarding the time spent on working or studying declined from approximately 8.5 hours in 1985 to 7.5 hours 2023. Similary, household chores showed a decrease by 0.3 hours over the mentioned interval. However, eating and drinking increased minimally from 1 hour to about 1.2 hours over the 28 years
Word Count: 172
