Our system will evaluate the answer based on this AI-generated description.
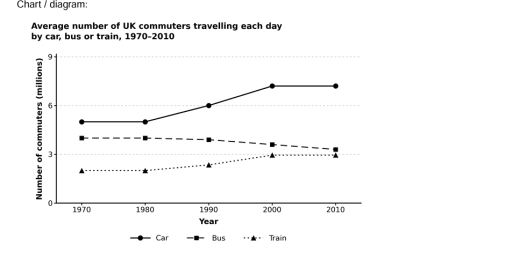
The image features a line graph titled "Average number of UK commuters travelling each day by car, bus or train, 1970-2010". The vertical y-axis is labeled "Number of commuters (millions)" with marked values 0, 3, 6, and 9. The horizontal x-axis is labeled "Year" with tick marks at 1970, 1980, 1990, 2000, and 2010. The legend identifies three transport types: Car (solid line with circular markers), Bus (dashed line with square markers), and Train (dotted line with triangular markers). Commuter data points are: Car at 5 million (1970), 5 million (1980), 6 million (1990), approximately 7.2 million (2000), and approximately 7.2 million (2010); Bus at 4 million (1970), 4 million (1980), approximately 3.9 million (1990), approximately 3.6 million (2000), and approximately 3.3 million (2010); Train at 2 million (1970), 2 million (1980), approximately 2.3 million (1990), approximately 3 million (2000), and approximately 3 million (2010).
Given the complexity of the image, the above description may not be entirely accurate.
Skyrocket your IELTS band score by 1-2 points in under a month with our premium plan!
Note: Both the topic and the answer were created by one of our users.
The line graph shows changes in the average number of UK commuters travelling by car, bus or train on a daily basis in ten-year intervals, from 1970 and 2010.
Overall, the number of people who travelling by car showed highest figures over the period, while the reverse was true for people who commuting by bus and train.
In detail, the number of people commuting by car leading the pack with higher figures throughout the span. Althought the figure levelled out at well under 6 million at the begining, it then experiencing a dramatic increase and amounting to 6 million in 1990. Following afterward, the respective figure continued its upward trajectory and showed an increase of 2 million in 2000 before stabilizzing at about 8 million.
The figures for bus and train showed somewhat different trend, with the former was oscillated between 4 and 5 million over the timeframe. While the latter was the category that atrracted small number of people and started at well under 3 million. Subsequent years, the number of people commuting by train increased gradually and totalled at 3 million within twenty years, after which the figure remained stable in this amount (at 3million) in the end of the period.
Word Count: 203
