🔥 Today Only: Save 30% on Premium — Offer Ends Soon! - Upgrade Now!
Bar Chart

Band 8+: The graph below shows the contribution of three sectors - agriculture, manufacturing and business and financial services - to the UK economy in the twentieth century.

Image for topic: The graph below shows the contribution of three sectors - agriculture, manufacturing and business and financial services - to the UK economy in the twentieth century.
Our system will evaluate the answer based on this AI-generated description.
The image displays a bar graph showing the percentage contribution of three sectors (Agriculture, Manufacturing, and Business and Financial) to the UK economy in the 20th century, with data points at 1900, 1950, 1975, and 2000. Agriculture is represented in blue, Manufacturing in green, and Business and Financial in purple. In 1900, Agriculture contributed approximately 10%, Manufacturing 55%, and Business and Financial 5%. In 1950, Agriculture decreased to just below 5%, Manufacturing also decreased to around 45%, and Business and Financial increased to approximately 32%. In 1975, all three sectors show a substantial decline, with Agriculture around 3%, Manufacturing just below 30%, and Business and Financial around 27%. In 2000, Agriculture is minimal at around 1%, Manufacturing further decreased to approximately 22%, and Business and Financial rose significantly to around 38%.
Given the complexity of the image, the above description may not be entirely accurate.
Note: Both the topic and the answer were created by one of our users.

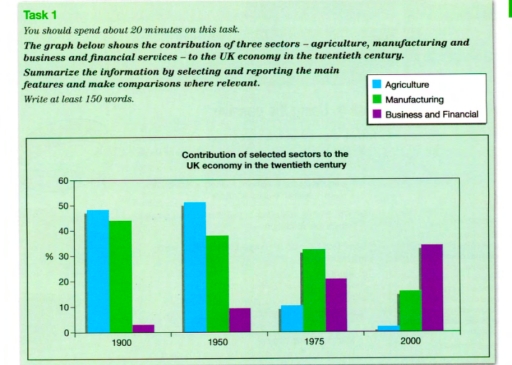
The bar chart compares how various economic sectors—agriculture, manufacturing, and commercial industries—have influenced the UK’s economic conditions.

Overall, it is clear that the fields of cultivation and fabrication, once pillars of the economy, became less significant over time, while the business sector took a leading position, gradually expanding its scale.

In 1900, agriculture and industry accounted for almost 50% and roughly 45%, respectively. By 1950, agriculture saw a slight increase to 53%, while the proportion of manufacturing declined by 6%. However, in the subsequent year, 2000, both sectors experienced a sharp downward trend. Agricultural products became considerably less profitable and important than they had been, reaching their lowest point of 2%. Meanwhile, the proportion of manufacturing decreased to 15%.

The share of business and financial services changed almost exactly the opposite of the other two industries. Starting at 3% in 1900, it grew steadily, increasing by almost 10% each subsequent decade, and eventually reached its highest level.

Word Count: 157

Answers On The Same Topic:

The graph below shows the contribution of three sectors – agriculture, manufacturing and business and financial services – to the UK economy in the twentieth century.

A glance at the bar chart reveals that it compares the economic contribution in agriculture, manufacturing, and business and financial services in the UK across four years in the twentieth century. It is noticeable that agriculture was the largest sector at the beginning of years, whereas business and financial sector was the lowest. However, while […]

The graph below shows the contribution of three sectors – agriculture, manufacturing and business and financial services – to the UK economy in the twentieth century.

At first we look at the contribution of agriculture in 1900. it is placed a bit lower than 50%. To 1950 it rose to above 50%. Then it was getting lower, In 1975 it hit a little more than 10% and to 2000 it hit almost 0%. As we look to the manufacturing sector, we […]

The graph below shows the contribution of three sectors – agriculture, manufacturing and business and financial services – to the UK economy in the twentieth century.

The graph illustrates how the three categories – agriculture, manufacturing, business, and financial services contributed the UK economy in the 20th century. Overall, while Agriculture and Manufacturing followed a similarly downward trend, the opposite was true for Business and financial services. Noticeably, Agriculture had the least contribution to the economy in 2000. It can be […]

The graph below shows the contribution of three sectors – agriculture, manufacturing and business and financial services – to the UK economy in the twentieth century.

The graph illustrates the proportion of three sectors – agriculture, manufacturing and business and financial servies – to the UK economy from 1900 to 2000. At first glance, it is apparent that the agriculture and manufacturing made up the majority in the first half of twentieth century, but then saw a steady decrease during the […]

The graph below shows the contribution of three sectors – agriculture, manufacturing and business and financial services – to the UK economy in the twentieth century.

The bar chart illustrates the contribution of three sectors to the UK economy in the twentieth century. Overall, it is clear that manufacturing and agriculture had the highest scores from 1900 to 1975, but they decreased in 2000. In contrast, the business and financial sector increased by the end of the period. On the other […]

See All

Other Topics:

the chart below shows the changes in three different areas of crime in Manchester city centre from 2003 and 2012.

The line graph illustrates the variation in three types of crime in Manchester city centre between 2003 and 2012. Overall, burglary initially recorded the highest crime figure; then it decreased dramatically and remained at its lowest level over the period. Meanwhile, at the beginning of the period, car theft reported the second-highest number; later it […]

the chart below shows the changes in three different areas of crime in Manchester city centre from 2003 and 2012.

The line graph illustrates the variation in three types of crime in Manchester city centre between 2003 and 2012. Overall, burglary initially recorded the highest crime figure; then it decreased sharply and remained at its lowest level over the period. Meanwhile, car theft in urban areas reported the second-highest number, and robbery witnessed the lowest […]

The bar chart shows the number of cars per 1000 people in 5 countries in Europe in 2005, 2009 and 2015 compared with the European average.

The diagram below illustrates the quantity of cars per 1000 people in 5 European countries between 2005 and 2015 and a comparison with the average of Europe. Overall, it can be seen, that throughout 10 years the number of transports, despite some fluctuations, saw a rise in Poland and Iceland, whereas UK and Latvia’s figures […]

The bar graph below shows the percentage growth in average property prices in three different countries between 2007 and 2010. Summarise the information by selecting and reporting the main features, and make comparisons where relevant.

The bar graph illustrates the growth in percentage of Algeria, China and Argentina for their property prices from 2007 to 2010. Overall, Algeria and China experienced by far the highest value while Argentina fluctuated over the given period. In 2007, Algeria was the top in growth of property prices with just over 6% among three […]

The bar chart gives information about the percentage of workers in different sectors of employment in three countries at different stages of economic development.

The chart gives information on proportion of people from Japan Brazil and India who are involved in three sectors of economics at different levels of development. Overall, the vast majority of Indian people are involved in agricultural sector, but considerably less in the others two sectors, while Japanese employees have a highest percentage of participation […]

The chart below shows the main reasons for deforestation in three different regions of the world during two separate decades. Summarise the information by selecting and reporting the main features and make comparisons where relevant.

The bar chart compares the main causes of deforestation in three regions: South America, Southeast Asia, and Central Africa. The figures are percentages of forest loss. Overall, each region has a different main reason. In South America, one cause is considerably bigger than the others, whereas in the other two regions, the causes are more […]

See All
We have detected unusual activity on your device.
Please verify your identity to continue.
Note: This verification step won't sign you in. If you have a premium account, please log in to access the service as usual.
Google/Gmail Verification
Or verify using Email/Code
We've sent a verification code to:
youremail@gmail.com (Not your email?)
Enter it below to complete the verification process.
Ensure your email address is correct, your inbox is not full, and you check your spam folder. If no email arrives, consider using an alternative email.
You will need a Premium plan to perform your action!
Note: If you already have a premium account, please log in to access our services as usual.

Plans & Pricing

Our mission is to make quality education accessible for everyone.
However, to keep our hardworking team running and this service alive, we genuinely need your support!
By opting for a premium plan, not only do you sustain us in achieving the mission, but you also unlock advanced features to enrich your learning experience.

Free

For learners who aren't pressed for time

What's included on Free
100+ Cambridge IELTS Tests
Instant IELTS Writing Task 1 & 2 Evaluation (2 times/month)
Instant IELTS Speaking Part 1, 2, & 3 Evaluation (2 times/month)
Instant IELTS Writing Task 1 & 2 Essay Generator (2 times/month)
500+ Dictation & Shadowing Exercises
100+ Pronunciation Exercises
Flashcards
Other Advanced Tools

Premium

For those serious about advancing their English proficiency, and for IELTS candidates aspiring to boost their band score by 1-2 points (especially in writing & speaking) in just 30 days or less

What's included on Premium
Save Your IELTS Test Progress & Analyze Mistakes By Question Type
Save Your Own Flashcard Sets & Use Them On Any Device
Unlock All Courses, IELTS Tests, Section & Part Practice
Unlimited AI Conversations
Unlimited AI Writing Enhancement Exercises
Unlimited IELTS Writing Task 1 & 2 Evaluation
Unlimited IELTS Speaking Part 1, 2, & 3 Evaluation
Checked Answers Will Not Be Published
Unlimited IELTS Writing Task 1 & 2 Essay Generator
Unlimited IELTS Speaking Part 1, 2, & 3 Sample Generator
Unlimited Usage Of Advanced Tools & AI Features
Priority Support within 24h (12-month plan only)

Due to the nature of our service and the provided free trials, payments are non-refundable.