Our system will evaluate the answer based on this AI-generated description.
The image shows a line graph comparing the number of contacts made through different methods (in-person, letter/email, and telephone) over a six-month period. In January, in-person contacts were the highest at 800, letter/email were at 200, and telephone at 600. In February, in-person contacts slightly decreased to 700, letter/email increased to 400, and telephone remained the same. In March, in-person contacts jumped to 1,600, letter/email decreased to 200, and telephone increased to 1,000. In April, in-person contacts reached 1,800, letter/email stayed at 200, and telephone increased to 1,200. In May, in-person contacts remained at 1,800, letter/email increased to 400, and telephone reached 1,400. In June, in-person contacts rose to 1,900, letter/email stayed at 400, and telephone peaked at 1,700. The graph has a Y-axis labeled from 0 to 2000 at intervals of 200 and an X-axis labeled with the months January to June.
Given the complexity of the image, the above description may not be entirely accurate.
Skyrocket your IELTS band score by 1-2 points in under a month with our premium plan!
Note: Both the topic and the answer were created by one of our users.
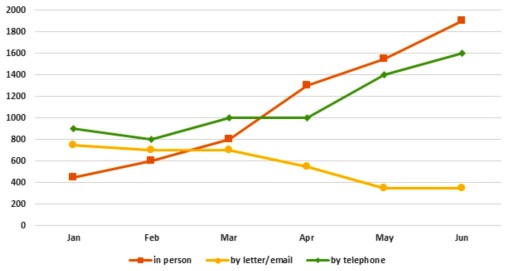
The line graph illustrates several questions experienced by the visitor information department in a town over a six month time in 2011.
Overall, numerous enquiries was faced physically by visitors and rapidly escalated at the end of the month while queries with letters or emails are done with tourists was lowest among all investigations.
In details, inspection done with face to face stood at over 400 in January and almost doubled in march, at 800. After that, the figure was dramatically increased to nearly 1900 from March to June. While questions faced by tourists with emails was slightly declined from January to may was about 775 to approximate 375 and shows stability at the end of time.
Moreover, numerous investigations done by telephone was at top at the beginning of the month was almost 900 and had minor fluctuation in between January and April was 800 and 1000. Similarly, after April, shows drastic increase to 1600 at June. In contrast, there is a variation of about 300 enquiries in between in person and by telephone.
Word Count: 175
