Our system will evaluate the answer based on this AI-generated description.
The image illustrates the number of participants (y-axis) across six activities from 2000 to 2020 (x-axis). Film club participants start at 50 in 2000, slightly increasing to 55 in 2005, fluctuating around 55 from 2010 to 2020. Martial arts start at 0 in 2000, rise sharply to 30 by 2005, reach 35 by 2010, and jump nearly vertically to 55 by 2015 and 60 in 2020. Amateur dramatics participants are 40 in 2000, grow to 45 by 2005, fall to 30 by 2010, dip more to 20 by 2015, and stabilize around 25 by 2020. Table tennis participants begin at 30 in 2000, drop to 25 in 2005, and continue declining to 20 by 2010, 15 by 2015, and 10 by 2020. Musical performances participants start at just below 20 in 2000, slightly decrease to 18 in 2005, drop further to approximately 14 by 2010, rise briefly to 15 by 2015 before descending sharply to 8 by 2020.
Given the complexity of the image, the above description may not be entirely accurate.
Skyrocket your IELTS band score by 1-2 points in under a month with our premium plan!
Note: Both the topic and the answer were created by one of our users.
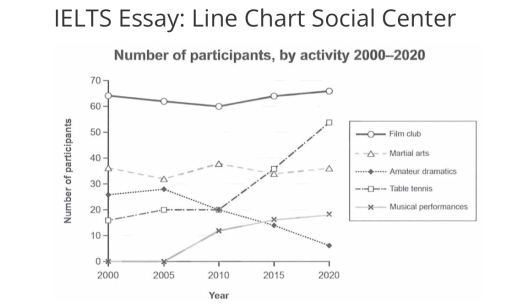
The given line graph illustrates data on the numbers of members individuals for various activities at Melbourne community centre in Australia from 2000 to 2020, over a period of 20years. In general terms it can be clearly seen that most of the activities show either a stable trend or an upper trend in its number of participants, while that of Amateur dramatics has diminished. In addition, Film club has remained as the most popular activity for the 20 year period.
Turning to the graph in more detail, the attendance in Film club started at 65individuals in 2000. The numbers slightly dropped to about 60participants in 2010 before reaching roughly 67 in 2020. In the meantime, the participation in Material arts remained stable with nearly 38individuals throughout the given period.
On the other hand, Table tennis and Musical performances experienced a significant increase in participation. The numbers in Table tennis notably increased from around 17 to 55 for the period shown. Similarly, Musical performances had no participants in the year 2000, but there was an rise to almost 18participants by 2020.
Word Count: 180