🔥 Today Only: Save 30% on Premium — Offer Ends Soon! - Upgrade Now!
Line Graph

Band 6+: The graph below shows the percentage of national arts funding allocated to five different sectors in the UK from 2000 to 2020. Summarise the information by selecting and reporting the main features and make comparisons where relevant.

Image for topic: The graph below shows the percentage of national arts funding allocated to five different sectors in the UK from 2000 to 2020. Summarise the information by selecting and reporting the main features and make comparisons where relevant.
Our system will evaluate the answer based on this AI-generated description.
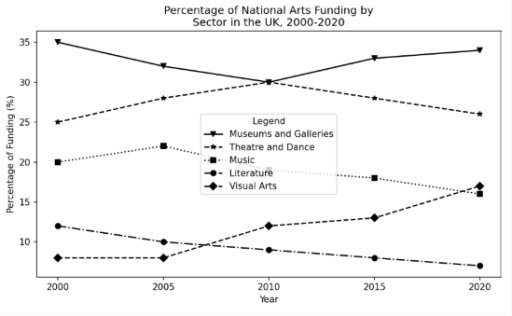
The image shows a line graph titled "Percentage of National Arts Funding by Sector in the UK, 2000-2020", with a vertical axis labeled "Percentage of Funding (%)" with ticks from 10 to 35 in increments of 5, and a horizontal axis labeled "Year" with points at 2000, 2005, 2010, 2015, and 2020. A box labeled "Legend" identifies five categories: Museums and Galleries, Theatre and Dance, Music, Literature, and Visual Arts. Data points for Museums and Galleries are 35% in 2000, 32% in 2005, 30% in 2010, 33% in 2015, and 34% in 2020. Data points for Theatre and Dance are 25% in 2000, 28% in 2005, 30% in 2010, 28% in 2015, and 26% in 2020. Data points for Music are 20% in 2000, 22% in 2005, 19% in 2010, 18% in 2015, and 16% in 2020. Data points for Literature are 12% in 2000, 10% in 2005, 9% in 2010, 8% in 2015, and 7% in 2020. Data points for Visual Arts are 8% in 2000, 8% in 2005, 12% in 2010, 13% in 2015, and 17% in 2020.
Given the complexity of the image, the above description may not be entirely accurate.
Note: Both the topic and the answer were created by one of our users.

The line chart illustrates the proportion of national arts funding in five distinct sectors between 2000 and 2020 .

Overall ,museum and galleries had the highest proprtion among all other sectors throughout the period . While,Literature recorded the lowest figure at the end of the period .Theatre and dance accounted for the second highest percentage .

Museums and galleries had the highest proportion over the period . Initially , it was 35% in 2000 before it declined to 30% in 2010 .It rose again to around 34% in 2020.Theatre and dance had the second highest proportion , it was 25% in 2000 , then it increased to 30% in 2010 before dropping to approximately 27% in 2020 .

Music and Literature experienced a downward trend over the period. Music recorded 20% in 2000, then it declined to around 17% in 2020 . Similarly , Literature was approximately 13% in 2000, followed by significant fell to around 5% at the end of the period. In contrast,visual arts experienced a considerable increased from 5% in 2000 to approximately 20% at the end of the period.

Word Count: 183

Answers On The Same Topic:

The graph below shows the percentage of national arts funding allocated to five different sectors in the UK from 2000 to 2020. Summarise the information by selecting and reporting the main features and make comparisons where relevant.

The line graph illustrates how the proportion of national arts funding allocated to five different sectors in the UK changed between 2000 and 2020. Overall, museums and galleries received the largest share of funding throughout the period, despite experiencing some fluctuations. Visual arts was the only sector to record an overall increase, whereas the remaining […]

The graph below shows the percentage of national arts funding allocated to five different sectors in the UK from 2000 to 2020. Summarise the information by selecting and reporting the main features and make comparisons where relevant.

The line graph illustrates the proportion of national arts funding distributed to five different sectors in the UK between 2000 and 2020. Overall, music and litterature are the only sectors to have experienced a downward trend, while museums and galleries is the most funded one. In 2000, music represented around 20% of the total funding. […]

The graph below shows the percentage of national arts funding allocated to five different sectors in the UK from 2000 to 2020. Summarise the information by selecting and reporting the main features and make comparisons where relevant.

The line graph illustrates the proportion of national arts funding allocated to five different sectors in the UK over a 20-year period between 2000 and 2020. Overall, it can be seen that whereas theatre and dance and visual arts increased their percentage of funding over the period, Museums and Galleries and Literature witnessed a fall […]

The graph below shows the percentage of national arts funding allocated to five different sectors in the UK from 2000 to 2020. Summarise the information by selecting and reporting the main features and make comparisons where relevant.

The graph illustrates what part of national arts funding was allocated to five different sectors in the United Kingdom between 2000 and 2020. Overall, only visual arts observed a steady increase of its funding and only literature observed a steady decline of funding. The rest of the categories experienced fluctuations. The biggest growth can be […]

See All

Other Topics:

The line graph below illustrates the percentage of total waste that was recycled, sent to landfill, and incinerated in one country from 2000 to 2020.

The linear graph depicts the proportion of exclusive wastage through three distinctive methods in a particular nation from two decades – from 2000 to 2020. Considering from an overall perspective, it can be comprehensively observed that the recycling method was consistently inclined, however, the landfill process gradually declined. Notably, the incineration process increased in the […]

The chart shows the percentage of people who accessed news from 4 sources from 1995 and projection to 2025.Summarize the information by selecting and reporting the main features, and make comparisons where relevant.

The line graph compares the percentages of individuals using four different sources to access news from 1995 and predictions to 2025. Overall, TV was the most used source until 2020 as the internet’s share is predicted to overtake its popularity by 2025, also experiencing the most substantial growth over the period. Additionally, the popularity of […]

The graph shows how elderly people in the United States spent their free time between 1980 and 2010.

The line graph illustartes how often individuals in the United States spent their free time from 1980 to 2010. Overall,it can be seen that,the most leading category was hiking while the theatre attendance figures turned out to be low. Initially,in 1980s reading rate demonstrate 30% and then it gradually increased to 40% until 1990s,however,between 1990s […]

The graph below gives information about car ownership in one European country from 1975 to 2005.

The line graph illustrates data about changes in car ownership divided in four categories namely, no car, 1 car, 2 cars and 3 cars in one European country over a thirty-year period between 1975 and 2005. Overall, most figures followed upward trends and remained stable throughout the period, with the exception of no car it […]

The graph below shows the number of passengers using four types of public transport in a European city between 2000 and 2025. Summarise the information by selecting and reporting the main features, and make comparisons where relevant.

The line graph compares the number of passengers using four types of public vehicle in a European city from 2000 to 2025. Overall, the metro accounted for the largest use of transport, while bicycle-sharing were lowest using transport, however in the end of the period bicycle and tram overtook the bus, which the first 3 […]

The graph below shows the number of passengers using four types of public transport in a European city between 2000 and 2025. Summarise the information by selecting and reporting the main features, and make comparisons where relevant.

The line graph compares the number of passengers using Bus, Metro, Tram, Bicycle-sharing in an European city between 2000 and 2025. Overall, Metro was the most popular transport in most years, while tram and bicycle-sharing grew constantly and overtook Bus by the end of the period. By contrast, buses followed a download pattern and finished […]

See All
We have detected unusual activity on your device.
Please verify your identity to continue.
Note: This verification step won't sign you in. If you have a premium account, please log in to access the service as usual.
Google/Gmail Verification
Or verify using Email/Code
We've sent a verification code to:
youremail@gmail.com (Not your email?)
Enter it below to complete the verification process.
Ensure your email address is correct, your inbox is not full, and you check your spam folder. If no email arrives, consider using an alternative email.
You will need a Premium plan to perform your action!
Note: If you already have a premium account, please log in to access our services as usual.

Plans & Pricing

Our mission is to make quality education accessible for everyone.
However, to keep our hardworking team running and this service alive, we genuinely need your support!
By opting for a premium plan, not only do you sustain us in achieving the mission, but you also unlock advanced features to enrich your learning experience.

Free

For learners who aren't pressed for time

What's included on Free
100+ Cambridge IELTS Tests
Instant IELTS Writing Task 1 & 2 Evaluation (2 times/month)
Instant IELTS Speaking Part 1, 2, & 3 Evaluation (2 times/month)
Instant IELTS Writing Task 1 & 2 Essay Generator (2 times/month)
500+ Dictation & Shadowing Exercises
100+ Pronunciation Exercises
Flashcards
Other Advanced Tools

Premium

For those serious about advancing their English proficiency, and for IELTS candidates aspiring to boost their band score by 1-2 points (especially in writing & speaking) in just 30 days or less

What's included on Premium
Save Your IELTS Test Progress & Analyze Mistakes By Question Type
Save Your Own Flashcard Sets & Use Them On Any Device
Unlock All Courses, IELTS Tests, Section & Part Practice
Unlimited AI Conversations
Unlimited AI Writing Enhancement Exercises
Unlimited IELTS Writing Task 1 & 2 Evaluation
Unlimited IELTS Speaking Part 1, 2, & 3 Evaluation
Checked Answers Will Not Be Published
Unlimited IELTS Writing Task 1 & 2 Essay Generator
Unlimited IELTS Speaking Part 1, 2, & 3 Sample Generator
Unlimited Usage Of Advanced Tools & AI Features
Priority Support within 24h (12-month plan only)

Due to the nature of our service and the provided free trials, payments are non-refundable.