Our system will evaluate the answer based on this AI-generated description.
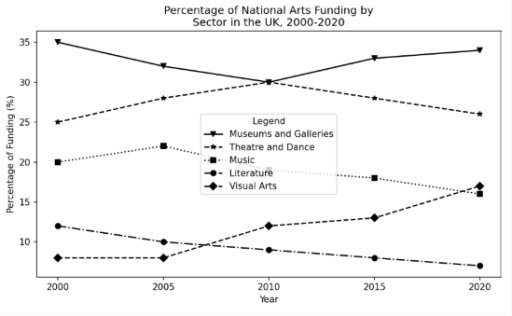
The image shows a line graph titled "Percentage of National Arts Funding by Sector in the UK, 2000-2020", with a vertical axis labeled "Percentage of Funding (%)" with ticks from 10 to 35 in increments of 5, and a horizontal axis labeled "Year" with points at 2000, 2005, 2010, 2015, and 2020. A box labeled "Legend" identifies five categories: Museums and Galleries, Theatre and Dance, Music, Literature, and Visual Arts. Data points for Museums and Galleries are 35% in 2000, 32% in 2005, 30% in 2010, 33% in 2015, and 34% in 2020. Data points for Theatre and Dance are 25% in 2000, 28% in 2005, 30% in 2010, 28% in 2015, and 26% in 2020. Data points for Music are 20% in 2000, 22% in 2005, 19% in 2010, 18% in 2015, and 16% in 2020. Data points for Literature are 12% in 2000, 10% in 2005, 9% in 2010, 8% in 2015, and 7% in 2020. Data points for Visual Arts are 8% in 2000, 8% in 2005, 12% in 2010, 13% in 2015, and 17% in 2020.
Given the complexity of the image, the above description may not be entirely accurate.
Skyrocket your IELTS band score by 1-2 points in under a month with our premium plan!
Note: Both the topic and the answer were created by one of our users.
The line graph illustrates the proportion of national arts funding distributed to five different sectors in the UK between 2000 and 2020.
Overall, music and litterature are the only sectors to have experienced a downward trend, while museums and galleries is the most funded one.
In 2000, music represented around 20% of the total funding. Until 2005, it witnessed a steady increase, peaking at around 22%. After this year, its proportion dropped significantly, reaching around 15% in 2020. Litterature, on the other hand, showed a steady downward trend throughout the whole period, going from around 12% in 2000 to under 5% in 2020.
However, the other sectors exhibited very different patterns. Visual arts funding proportion plateaued at 5% approximately until 2005 before rising up to over 15% in 2020. Along with it, theatre and dance percentage of national arts funding surged from 25% in 2000 to over 30% in 2010 before falling back down to slightly over 25% in 2020. Finally, museums and galleries, the most funded sector, showed a steady decrease from 2000 to 2010, going from 35% to 30% before climbing back up to 35% in 2020.
Word Count: 189
