Our system will evaluate the answer based on this AI-generated description.
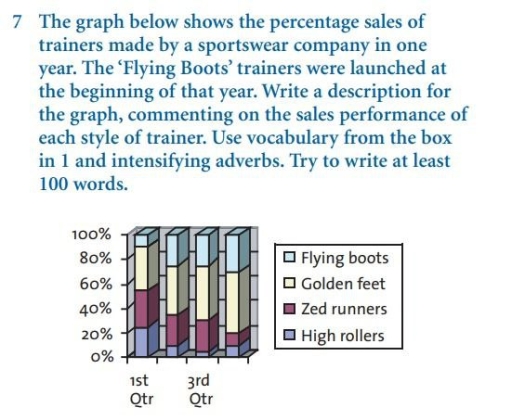
The image contains a bar graph displaying percentage sales of four different styles of trainers made by a sportswear company across two quarters (1st and 3rd) in a year. The first bar in each quarter represents 'Flying boots' with sales just below 20% in the 1st quarter and a slight increase to just above 20% in the 3rd quarter. The second bar represents 'Golden feet' with sales starting at approximately 30% in the 1st quarter and decreasing to just below 20% in the 3rd quarter. The third bar is for 'Zed runners' with sales just above 20% in the 1st quarter and just below 40% in the 3rd quarter. The fourth bar is 'High rollers' showing sales at roughly 30% in the 1st quarter and increasing to just over 40% in the 3rd quarter. There are no specific numerical percentages provided for each bar, only estimations based on the percentage scale on the vertical axis. The legend on the right indicates the pattern associated with each trainer style on the graph.
Given the complexity of the image, the above description may not be entirely accurate.
Skyrocket your IELTS band score by 1-2 points in under a month with our premium plan!
Note: Both the topic and the answer were created by one of our users.
The bar chart indicates the sales of sneakers in relation to the percentage made by a sportswear company in 12 months.
A closer look at the graph reveals that as “Flying boots” have only appeared, it becomes clear, why they had the smallest amount among all kinds of trainers in the first quarter (only about 10%). But later it can be seen that they followed an upward trend, reaching approximately 30% in the last quarter.
However, it becomes clear that the number of “Zed runners” sales has been decreasing for months, achieving about 10% in the last quarter. As for “Golden feet”, it has made its popularity bigger, experiencing a sudden increase in the second, and in the last quarter. Nevertheless, the amount of “High rollers” sales has been fluctuating for months, hitting the highest point in the first quarter and having 20%.
To sum up, it can be seen that “Flying boots” and “Golden feet” have increased their number of sales, while “Zed runners”and “High rollers” have never been stable and decreased the amount of sales.
Word Count: 177
