Our system will evaluate the answer based on this AI-generated description.
The image presents a line graph depicting population percentages across three age groups over multiple decades from 1960 to 2040. In 1960, age group 0-14 constitutes 40%, 15-64 comprises 60%, and 65+ is 5%. By 1970, age group 0-14 is at 37%, 15-64 holds at 61%, and 65+ reaches 7%. In 1980, group 0-14 marks 33%, 15-64 achieves 62%, and 65+ stands at 10%. By 1990, 0-14 has declined to 30%, age 15-64 remains stable at 63%, and 65+ increases to 13%. In 2000, age 0-14 is noted at 28%, 15-64 at 63%, and 65+ at 15%. By 2010, group 0-14 registers 27%, age 15-64 drops to 60%, and 65+ rises to 18%. In 2020, 0-14 decreases slightly to 25%, 15-64 is at 59%, and 65+ shows a growth to 20%. By 2030, predictions for age 0-14 are 23%, 15-64 at 57%, and 65+ at 23%. In 2040, projections indicate age 0-14 at 22%, 15-64 at 55%, and 65+ increases to 25%.
Given the complexity of the image, the above description may not be entirely accurate.
Skyrocket your IELTS band score by 1-2 points in under a month with our premium plan!
Note: Both the topic and the answer were created by one of our users.
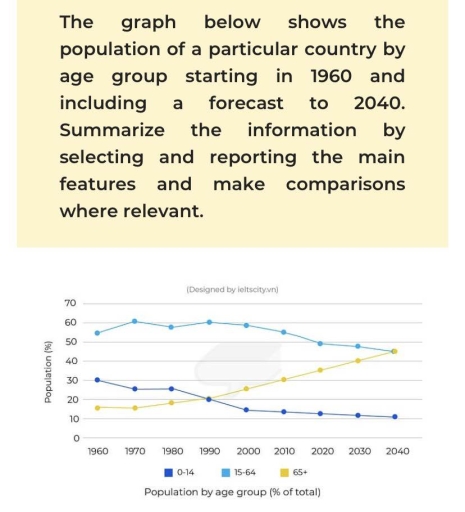
The line graph illustrate the proportion of three groups in a contry’s population from 1960 to 2040, and including forecast.
Overall, the part of people aged 0-14 is expected to decline significantly, while the proportion of those aged 65 and over will rise steadily. Meanwhile, the 15-64 age group will the largest with 65 and over age group, although it will show a gradual decrease toward the end of the period.
In 1960, people aged 15-64 was about 55% of the population, and this figure increased slightly until 1970. After that, it started to drop and is expected to fall around 45% by 2040. The 0-14 group also decreased sharply, from near 30% in 1960 to approximately 10% in 2040. Age group 65 and over there will a constant increase from around 15% to about 45% at the end of the period.
In conclusion, the graph shows a steady fall in the young people and a strong rise in elder people, with both the older and working age group becoming equal at the end of the period.
Word Count: 177
