Our system will evaluate the answer based on this AI-generated description.
The image presents a line graph depicting population percentages across three age groups over multiple decades from 1960 to 2040. In 1960, age group 0-14 constitutes 40%, 15-64 comprises 60%, and 65+ is 5%. By 1970, age group 0-14 is at 37%, 15-64 holds at 61%, and 65+ reaches 7%. In 1980, group 0-14 marks 33%, 15-64 achieves 62%, and 65+ stands at 10%. By 1990, 0-14 has declined to 30%, age 15-64 remains stable at 63%, and 65+ increases to 13%. In 2000, age 0-14 is noted at 28%, 15-64 at 63%, and 65+ at 15%. By 2010, group 0-14 registers 27%, age 15-64 drops to 60%, and 65+ rises to 18%. In 2020, 0-14 decreases slightly to 25%, 15-64 is at 59%, and 65+ shows a growth to 20%. By 2030, predictions for age 0-14 are 23%, 15-64 at 57%, and 65+ at 23%. In 2040, projections indicate age 0-14 at 22%, 15-64 at 55%, and 65+ increases to 25%.
Given the complexity of the image, the above description may not be entirely accurate.
Skyrocket your IELTS band score by 1-2 points in under a month with our premium plan!
Note: Both the topic and the answer were created by one of our users.
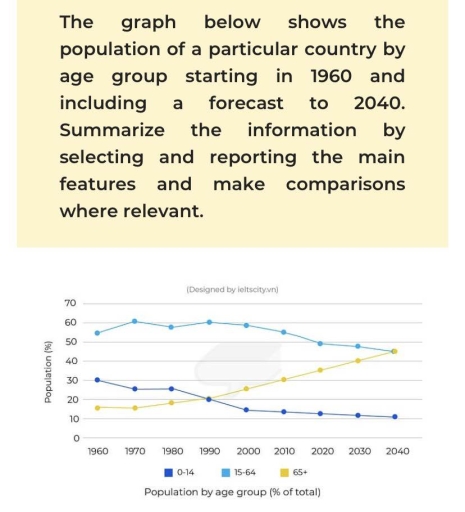
The graph illustrates the population of a particular country by age group starting in 1960 and including a forecast to 2040.
initially, we seen that 80 decades data is given. we begin with 1960,population of above 65 years was less than population of age group between 15 to 64. However, till the age of 14 children ratio was little higher than above 65 . On the other hand, above 65 age senior citizens percetage climbed up steadily till 45 percent in 2040. In the opposite, Age group 15 to 64 ratio gradually diminised in 2040 till 42 percent. people lies between 0 to 14 population ratio were at notable reduction. particularly, one thing was noticeable in 1990 where population of two groups was at constant ratio . In contrast, percentage in 2040 age greater 15 and 64 groups were similar.
we can summerize that population ratio of different ages of group was various. Older percentage increase with the time wheras, youth age people population decreased due to passage of time.
Word Count: 170
