Our system will evaluate the answer based on this AI-generated description.
The image contains a graph illustrating sales data from five insurance companies between 1997 and 2017, measured in millions of dollars; for 1997, Company A sold approximately 40M, Company B about 40M, Company C roughly 50M, Company D close to 10M, and Company E around 25M; for 2002, Company A sold approximately 30M, Company B near 30M, Company C around 40M, Company D about 15M, and Company E close to 20M; for 2007, Company A sales rose to 50M, Company B dropped to 20M, Company C increased to 60M, Company D remained stable at about 15M, and Company E increased to approximately 25M; by 2012, Company A sold nearly 45M, Company B dipped further to 10M, Company C rose to around 70M, Company D stayed about 20M, and Company E was steady at 25M; finally in 2017, Company A sales reached 60M, Company B remained at 10M, Company C peaked at 80M, Company D declined back to 10M, and Company E slightly increased to around 30M.
Given the complexity of the image, the above description may not be entirely accurate.
Skyrocket your IELTS band score by 1-2 points in under a month with our premium plan!
Note: Both the topic and the answer were created by one of our users.
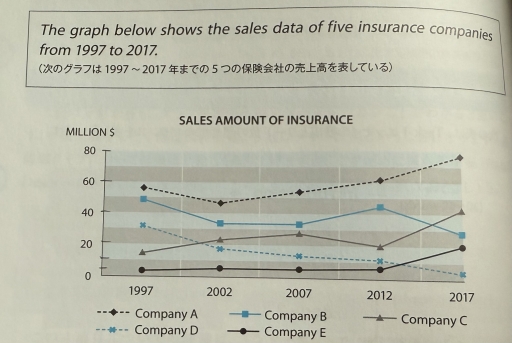
The line graph illustrates the purchases of data of five insurance companies between 1997 and 2017, measuring it in millions of dollars. Overall, the data reveals that Company A and C accounted for the largest shares, while Company D and E consumed the least amount of sales.
At the beginning of year 1997, Company A had around $60 million in sales, after that in 2002, it had a slight decline, leading it to be around $50 million. Following that, the sales skyrocketed until it reached $80 million. Subsequently, Company B had around $50 million at the beginning, then it decreased to approximately $30 million, and it remained stable until the year 2007. Following that, the sales had risen, reaching $45 million. Then suddenly, it plummeted.
In 1997, Company C and D had around $15 and $32 million, following that company C had a gradual increase in the number of sales in 2007, reaching its peak to approximately $29 million. Then it declined, then increased once again, whereas Company D had around $35 million in the beginning, then it plummeted to around having nothing.
Finally, Company E had nothing in the start of 1997, then it had a significant increase, leading it to reach $20 million
Word Count: 205
