Our system will evaluate the answer based on this AI-generated description.
The image displays a line graph with four different lines, each representing Facebook, Google, Apple, and Yahoo from the years 2011 to 2016. The vertical axis ranges from 0 to 35,000 with increments of 5,000, while the horizontal axis lists the years 2011 through 2016. In 2011, Facebook, Google, and Apple start at 0, while Yahoo starts around 12,000. In 2012, Facebook jumps to over 30,000, Google remains close to 0, Apple increases to around 2,000, and Yahoo drops to about 6,000. By 2013, Facebook drops below 5,000, Google increases to around 5,000, Apple rises to nearly 10,000, and Yahoo decreases to almost 0. In 2014, Facebook remains under 5,000, Google climbs to nearly 20,000, Apple approaches 15,000, and Yahoo stays close to 0. In 2015, Facebook is still below 5,000, Google exceeds 20,000, Apple surpasses 15,000, and Yahoo remains around 0. Finally, in 2016, Facebook stays under 5,000, Google maintains above 20,000, Apple continues to increase exceeding 20,000, and Yahoo stays near 0.
Given the complexity of the image, the above description may not be entirely accurate.
Skyrocket your IELTS band score by 1-2 points in under a month with our premium plan!
Note: Both the topic and the answer were created by one of our users.
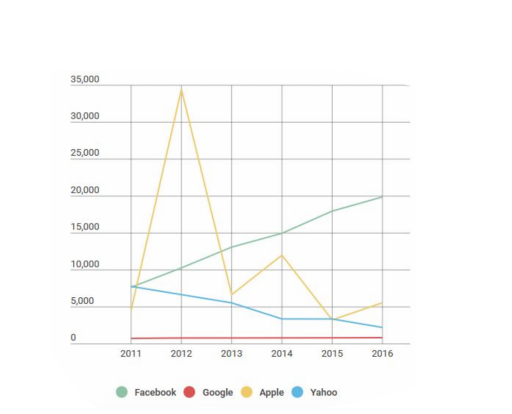
The line graph illustrates the stock prices of four prominent technology companies over the course of six years from 2011 to 2016.
Overall, Facebook experienced a consistent upward trend, Yahoo saw a continuous decline in stock value, Apple exhibited erratic fluctuations, and Google maintained a relatively stable stock price.
Facebook initiated the period with a stock value of approximately 7,500 and demonstrated a continuous growth, reaching a peak of around 20,000 by the end of 2016. In contrast, Yahoo, which started with a similar value to Facebook, experienced a downward trend annually, hitting a low of about 2,500 by 2016.
Apple commenced at just under 5,000 in 2011, abruptly surging to almost 35,000 in the subsequent year, then dropping to approximately 7,000 by 2013. The stock price recovered slightly to around 12,000 in 2014, before declining to slightly over 5,000 by 2016. Throughout the entire period, Google’s stock price remained relatively stable, hovering around 1,000.
Word Count: 155
