Our system will evaluate the answer based on this AI-generated description.
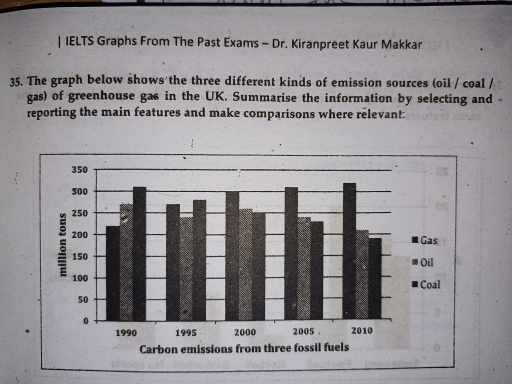
The image is a bar graph displaying carbon emissions from three fossil fuels (Gas, Oil, Coal) in the UK over four five-year intervals (1990, 1995, 2000, 2005, 2010). In 1990, Gas emissions were approximately 225 million tons, Oil approximately 75 million tons, and Coal approximately 200 million tons. In 1995, Gas emissions increased to around 275 million tons, Oil decreased to approximately 50 million tons, and Coal remained consistent at 200 million tons. In 2000, Gas emissions remained at 275 million tons, Oil decreased further to approximately 25 million tons, and Coal reduced to approximately 150 million tons. In 2005, Gas emissions decreased to around 225 million tons, Oil maintained at approximately 25 million tons, and Coal increased to approximately 175 million tons. In 2010, Gas emissions further decreased to approximately 175 million tons, Oil remained at approximately 25 million tons, and Coal reduced to around 150 million tons.
Given the complexity of the image, the above description may not be entirely accurate.
Skyrocket your IELTS band score by 1-2 points in under a month with our premium plan!
Note: Both the topic and the answer were created by one of our users.
The bar chart illustrates the three various types of emission sources of greenhouse gas in the UK.
Overall, it is evident that the figure for emission increases in gas,there were fluctuations and decreases in others.
The proportion of emission was around 220 million dollars in 1990, which increased to about 270 million dollars in 1995, as well as a rise of 30 million dollars in 2000. Between 2000 and 2010, there was a growth of 20 million dollars. Talking about oil, the figure was nearly 260 million at the beginning of the period, whereas it decrease to approximately 240 million dollars in the following 5 years, along with a climb of 20 million dollars in 2000. From 2000 to 2010, it fluctuated by 50 million dollars.
When it comes to coal, the proportion was nearly 310 million dollars in the initial year, while the figure dropped by 60 million dollars in the following 10 years, followed by a decline of about 20 million dollars in 2005. Over the period from 2005 to 2010, it saw a fall of almost 80 million dollars.
Word Count: 182
