Our system will evaluate the answer based on this AI-generated description.
The image presents a bar graph illustrating the production of an unspecified item in million tonnes from 1990 to 2010 for Brazil, Colombia, Indonesia, and Vietnam. In 1990, Brazil produced approximately 0.8 million tonnes, Colombia around 0.2 million tonnes, Indonesia roughly 0.6 million tonnes, and Vietnam close to 0.4 million tonnes. In 1995, Brazil's production increased to around 1 million tonnes, Colombia's slightly rose to just above 0.2 million tonnes, Indonesia's jumped to nearly 1.4 million tonnes, and Vietnam's escalated to approximately 1.6 million tonnes. By 2000, Brazil's production decreased to about 0.4 million tonnes, Colombia's remained stable at just above 0.2 million tonnes, Indonesia's reduced to roughly 0.8 million tonnes, and Vietnam's slightly increased to nearly 1.8 million tonnes. Lastly, in 2010, Brazil produced around 0.2 million tonnes, Colombia approximately 0.2 million tonnes, Indonesia close to 0.4 million tonnes, and Vietnam maintained its production at nearly 1.8 million tonnes.
Given the complexity of the image, the above description may not be entirely accurate.
Skyrocket your IELTS band score by 1-2 points in under a month with our premium plan!
Note: Both the topic and the answer were created by one of our users.
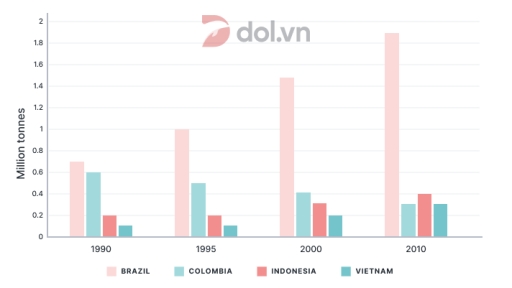
The bar chart illustrates information about coffee manufacture in 4 different countries around 20 years from 1990.
Overall, while Brazil, Indonesia and Vietnam produced more and more coffee over time, Colombia’s coffee production decreased every years.
The figure of coffee in Brazil remained the highest over 20 years, with around 0.7 million tonnes at first then continued to increased and and reached the peak at 1.7 million tonnes in 2010. Coffee production in Indonesia was lowest in 1990 with 0.2 million tonnes and unchanged in 5 years after, likely Vietnam was about 0.1 millions tonnes. In 10 years after this number in Indonesia and Vietnam began to rise and both peaked in 2010, with 0.4 millions tonnes in Indonesia and approximately 0.3 million tonnes in Vietnam.
Colombia’s coffee manufacture was only figure decrease during 20 years. This country produced roughly 0.6 million tonnes coffee at first and it was the highest in 20 years. The figure of coffee was a downward trend and hit the bottom with 0.3 million in the end.
Word Count: 172
