Our system will evaluate the answer based on this AI-generated description.
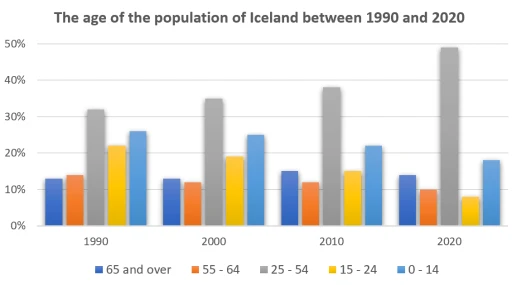
The image displays a bar graph demonstrating the age distribution of Iceland's population from 1990 to 2020 in five-year increments, with five age ranges represented by distinct colors. In 1990, ages 0-14 accounted for approximately 30%, ages 15-24 constituted about 15-20%, ages 25-54 comprised around 45%, ages 55-64 made up roughly 8%, and ages 65 and over occupied about 10%. In 2000, ages 0-14 decreased to about 25%, ages 15-24 remained around 15-20%, ages 25-54 increased to almost 50%, ages 55-64 stayed at 8%, and ages 65 and over rose to nearly 12%. In 2010, ages 0-14 further dropped to approximately 20%, ages 15-24 stayed around 15-20%, ages 25-54 decreased to about 45%, ages 55-64 increased to nearly 10%, and ages 65 and over climbed to almost 15%. Lastly, in 2020, ages 0-14 stayed at 20%, ages 15-24 remained around 15-20%, ages 25-54 decreased to roughly 40%, ages 55-64 increased to around 12%, and ages 65 and over rose to roughly 20%.
Given the complexity of the image, the above description may not be entirely accurate.
Skyrocket your IELTS band score by 1-2 points in under a month with our premium plan!
Note: Both the topic and the answer were created by one of our users.
The bar graph illustrates the changing proportion of Iceland’s age population between 1990 and 2020. Overall, it can be seen that the adult population, which ranges between 25-54 years of age, accounted for most of Iceland’s population throughout the last three decades. In 1990, this population accounted for slightly above 30% of the total population, and significantly increased until almost reaching 50% in 2020.
On the other hand, a contrasting trend is seen among the children and young adult populations. Although accounted for the second and third largest age group in Iceland, these groups showed a significant decrease in proportion to almost 5% and 10%, consecutively, in just three decades.
Meanwhile, another two minor age groups, the late adult and elderly, has shown a more plateaued changes in the last three decades. The late adult, which ranges between 55-64, accounted for only 13% in 1990, and continues to decrease until reaching 10% in 2020. The elderly showed a more stagnant proportion of almost 13% in the last three decades.
Word Count: 169
